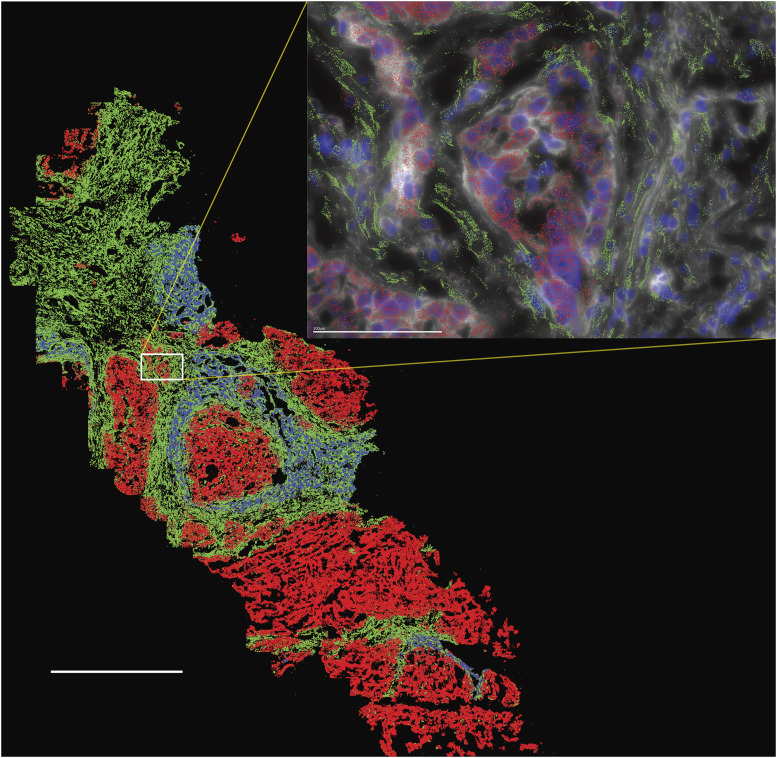
Figure 7.
Spatial transcriptional analysis of an FLC tumor tissue. Three transcripts are shown: Cyp3A (blue) that is high in normal tissue and downregulated in FLC, Muc13 (red) that is high in FLC and low in normal tissue, and Col11A1 (green) that is high in stromal cells. The distinction between the tumor and stromal (stellate) cells can be seen in the inset where the nuclei are also labeled with DAPI (dark blue) and the Vizgen Cell Boundary Staining Kit (white). Inset:, the Col11A1 was only seen above the wispy stellate cells and not above the FLC cells. Scale bar, large image, 1 mm; inset, 100 μm.

