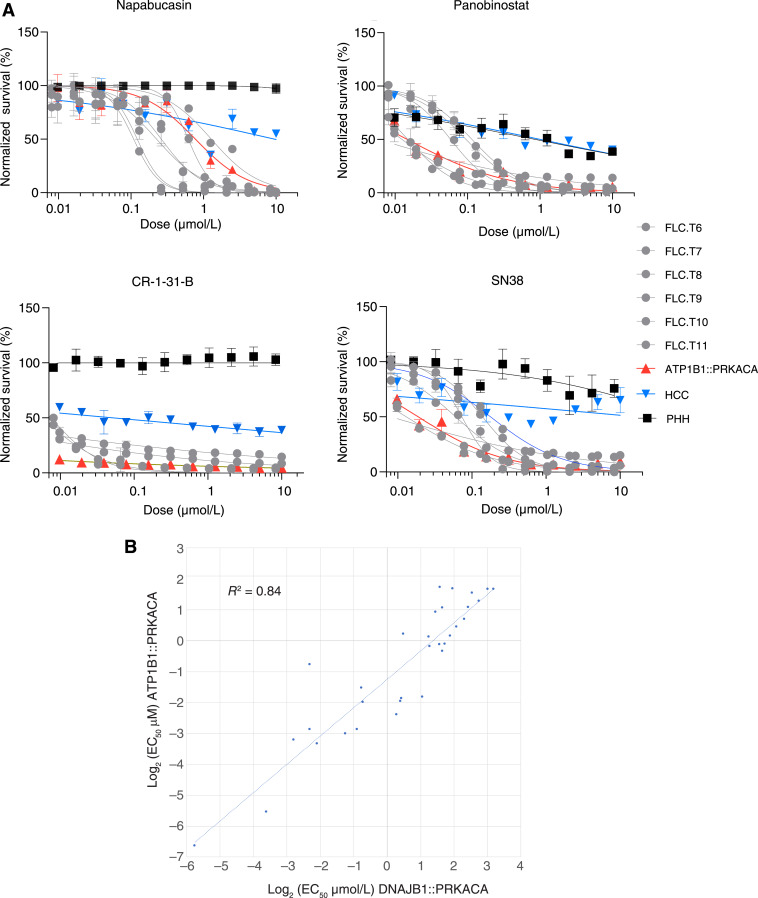
Figure 8.
Drug–response profile of cells freshly resected from patient tumors. A, Dose–response curve of four effective drugs against FLC against cells dissociated directly from patients’ tumors with DNAJB1::PRKACA (gray), HCC (blue), ATP1B1::PRKACA (red), or PHH (black). Each patient sample was tested in triplicate. Error bars, SD. Drugs were tested at 10 μM to 10 nM with twofold serial dilution. The y-axis shows normalized percent survival calculated as 100 − [(positive control − drug response)/(positive control − negative control) × 100]. Cells were treated for 72 hours, and normalized percent survival was quantified using CellTiter-Glo. B, Comparison of the EC50 in cells dissociated from patient tumors with DNAJB1::PRKACA mutation vs. cells dissociated from patient tumors with ATP1B1::PRKACA mutation.

