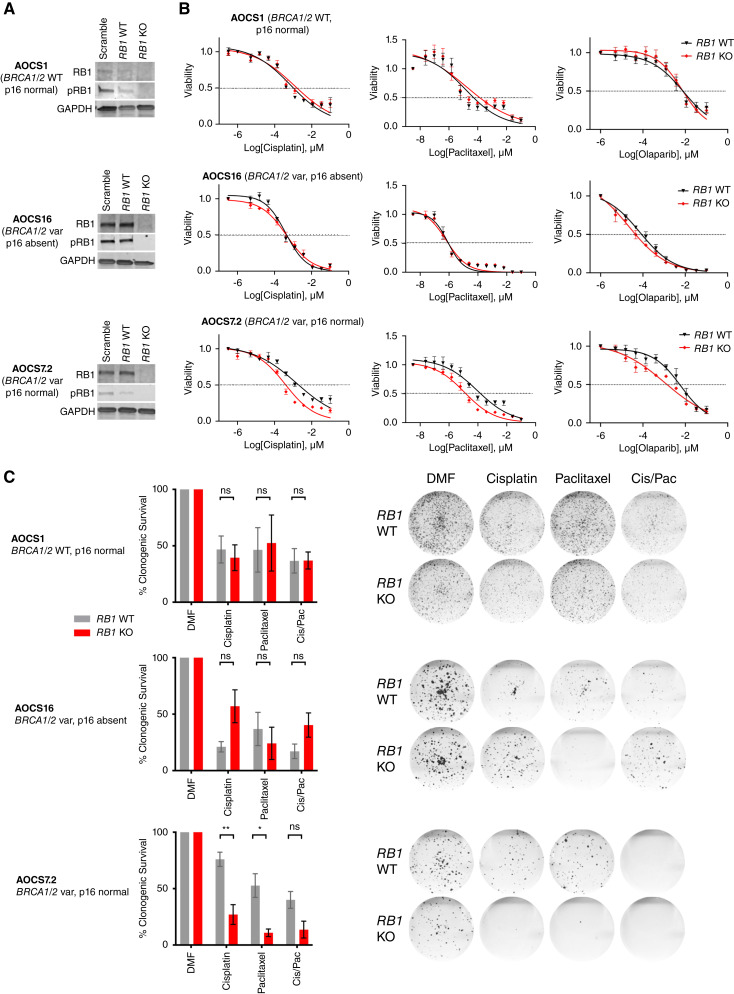
Figure 2.
Sensitivity to therapeutic agents in BRCA1-altered cell lines with RB1 knockout. A,RB1 was knocked out using CRISPR/Cas9 in three patient-derived Australian Ovarian Cancer Study (AOCS) HGSC cell lines with either wild-type or altered BRCA1 (BRCA1 var) background. Representative Western Blots show protein levels of RB1 and phosphorylated RB1 (pRB1) compared with GAPDH loading control in single-cell cloned, homozygous RB1 wild-type (WT) and knockout (KO) colonies in comparison with heterogeneous populations with a scramble single guide RNA (sgRNA). Independent blots were used for RB1 and pRB1. B, Cell viability was compared between RB1 WT and KO clones following treatment with cisplatin (72 h), paclitaxel (72 h), or olaparib (120 h). Nonlinear regression drug curves are shown; P values are shown in Supplementary Table S18 (n = 3). Error bars indicate ± SEM; for some values, error bars are shorter than the symbols and thus are not visible. C, Proportion of surviving colonies following 16 days of treatment with cisplatin, paclitaxel, or a combination of both (Cis/Pac; with half of the IC50 determined per drug and cell line respectively) relative to DMF vehicle control (n = 3 replicates). Data are presented as mean ± SEM. Mean values were compared by Student’s t test (ns, not significant; *, P < 0.05; **, P < 0.01). Representative scans of the fixed cell colonies stained with crystal violet are shown for each condition.

