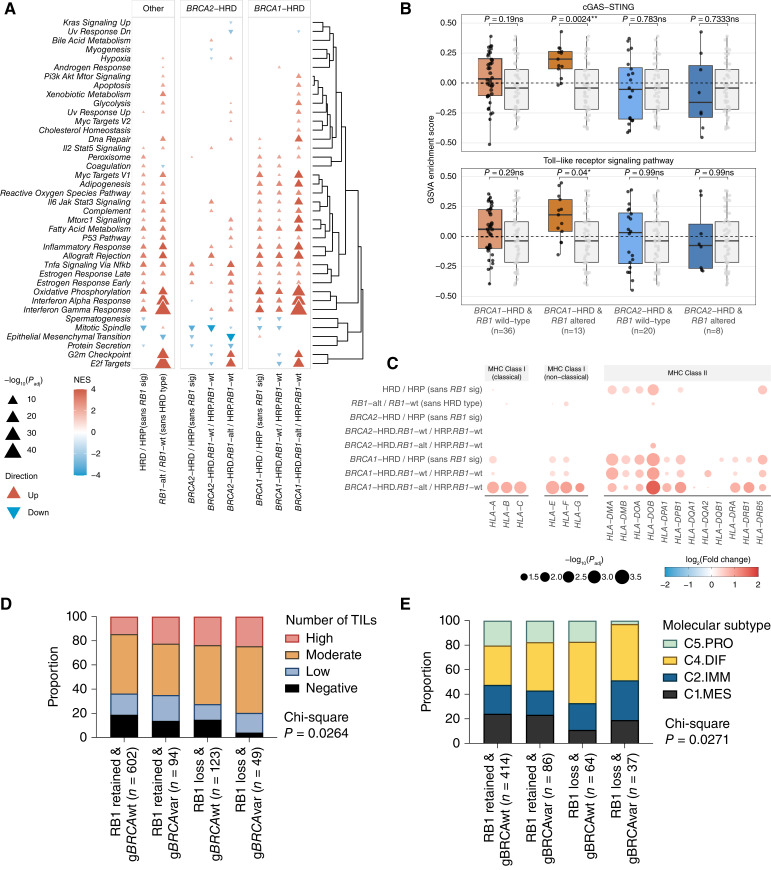
Figure 4.
Characterization of HGSC with co-loss of RB1 and BRCA. A, GSEA indicating up- and downregulated pathways in tumors according to BRCA and RB1 status. RB1-alt, RB1 altered; RB1-wt, RB1 wild-type. B, Boxplots comparing GSVA pathway enrichment scores of the cGAS-STING and Toll-like receptor signaling pathways between molecular subgroups; points represent each sample, boxes show the interquartile range (25th–75th percentiles), central lines indicate the median, and whiskers show the smallest/largest values within 1.5 times the interquartile range. Colored boxes with black points indicate the HRD and/or RB1 altered groups, whereas the gray boxes with gray points indicate the HRP and RB1 wild-type group. P values were calculated using a two-sided Mann–Whitney-Wilcoxon test. Benjamini–Hochberg adjusted P values are shown above each pairwise comparison (*, P < 0.05; **, P < 0.01; ns, P ≥ 0.05). C, Bubble plot summary of HLA gene expression comparisons using DESeq2 between HGSC tumors grouped by HRD and/or RB1 status as shown. The size of the bubbles corresponds to the negative log10 Benjamini–Hochberg adjusted P value (Padj) and only values with Padj ≤ 0.1 are shown. The color and intensity correspond to the log2fold change. Genes are grouped by their classes. D, Proportion of TILs in HGSC tumors grouped by RB1 protein expression and BRCA germline status. χ2P value is indicated. E, Proportion of tumors classified as each HGSC molecular subtype (13) grouped by RB1 expression and BRCA germline status. χ2P value is indicated. C4.DIF, C4/differentiated subtype; C2.IMM, C2/immunoreactive subtype; C1.MES, C1/mesenchymal subtype; C5.PRO, C5/proliferative subtype.

