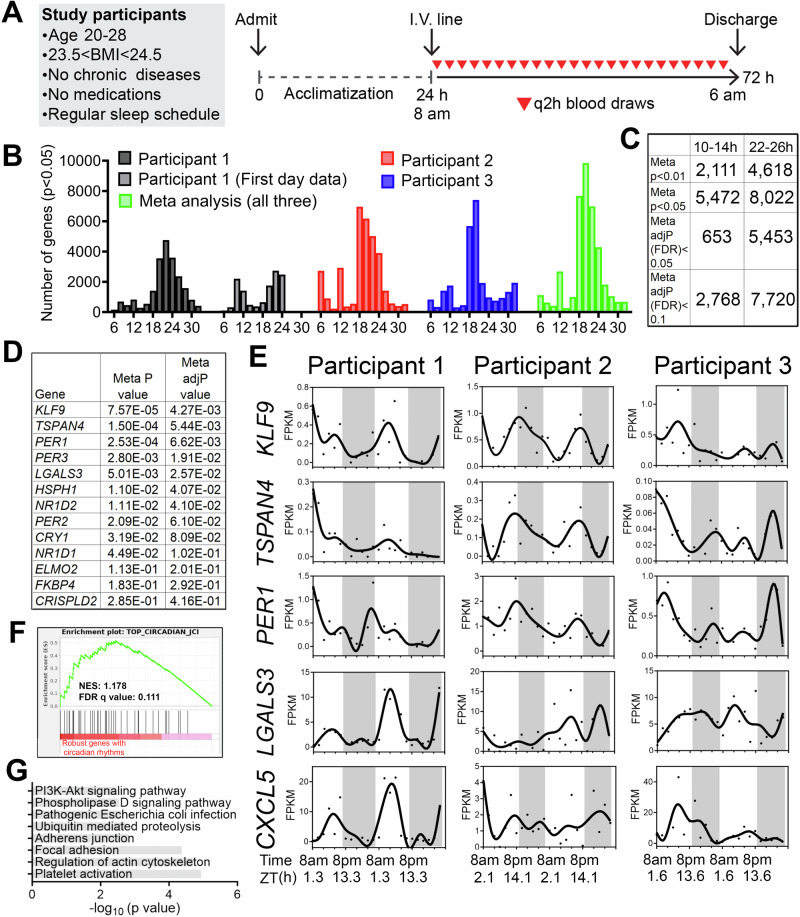
Fig. 1. Identification of inter-individual variability of ~24-h and ultradian rhythms of gene expression in peripheral white blood cells of humans.
A Human protocol and study schematic. B–D Histograms showing the period distributions of all rhythmic genes uncovered from the three participants (with p value < 0.05) as well as the period distribution of rhythmic genes calculated by the meta p values (meta p < 0.05). For the first individual, periods calculated from all 48 h of data, or the first 24 h of the dataset were both shown. C Table summarizing the number of ~24-h and ~12-h genes with different statistical cut-offs. D Table listing the meta P and meta adj-P (FDR) values of thirteen ~24-h genes previously used as training datasets for predicting ~24-h phase from human blood samples15. E Raw temporal expression profile (dot) and spline fit (solid line) of five of the thirteen ~24-h genes. F Gene set enrichment analysis (GSEA) showing enrichment of a previously identified set of top forty robustly-cycling ~24-h genes in human white blood cells15 with robust ~24-h rhythmicity in our study. G GO analyses of top KEGG pathways for ~24-h genes with meta adj-P (FDR) less than 0.01.

