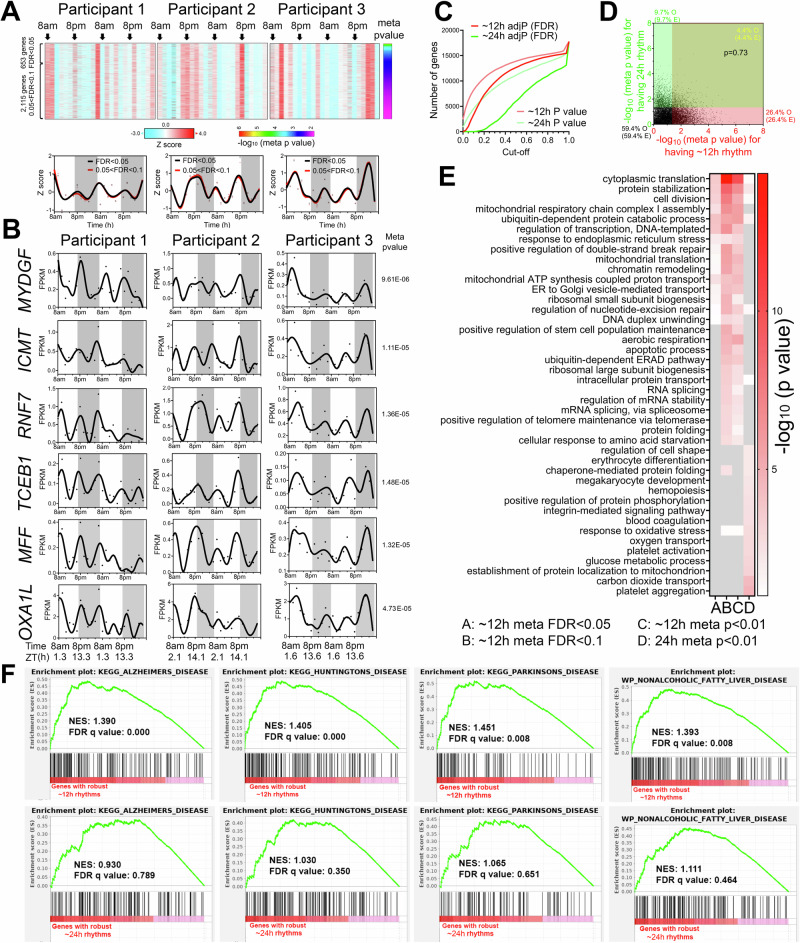
Fig. 2. ~12-h gene expression rhythms are enriched in mRNA and protein homeostasis pathways.
A Heatmap and quantification of ~12-h genes from all three participants with meta adj-P (FDR) values less than 0.05 or between 0.05 and 0.1. B Raw temporal expression (dot) profile and spline fit (solid line) of six ~12-h genes with meta p values also shown. C Cumulative distribution of the number of ~24-h and ~12-h genes with different meta p and meta adj-P cut-offs. The ~24-h data set consisted of a 4 h sampling interval so that the period to sampling interval was matched to the ~12-h data set. D Scatter plot comparing log-transformed meta p values for each gene exhibiting ~24-h versus ~12-h rhythms. Both observed and predicted percentage of genes (under the null hypothesis that ~12-h and ~24-h genes are independently regulated) with meta p value smaller or larger than 0.05 are further shown. P value of 0.73 is calculated by Chi-square test. E GO analysis of ~24-h and ~12-h genes with different statistical cut-offs. F GSEA showing enrichment scores of different gene sets for ~12-h (top) and ~24-h (bottom) genes.

