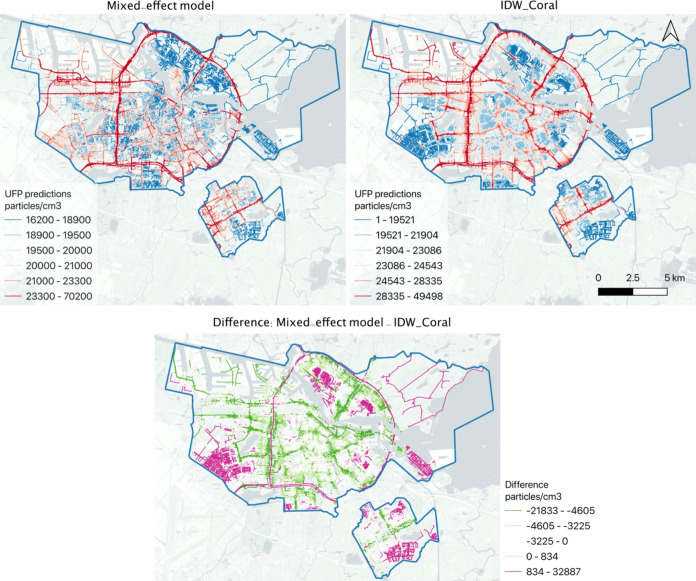
Figure 5.
Top left: Spatial map of UFP estimations from the mixed-effect model (publicly available in Google Insights Explorer21). Top right: The predictions from IDW_Coral. Bottom: The difference map (Mixed_effect-IDW_Coral). Spatial maps of UFP predictions with a unified legend are plotted in Appendix Figure S3.

