
Figure 2.
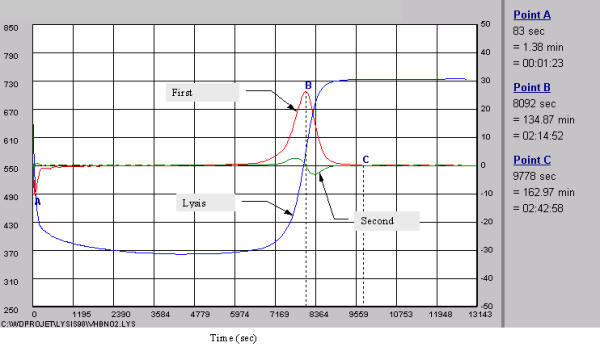
The lines represent the complete fibrinolysis process including formation, latency and dissolution of the fibrin clot, the first and second derivative. All points (A,B,C) are expressed in seconds, minutes and hours. The A point represents the peak time of fibrin clot formation, B point, the peak to fibrin clot lysis, and C point, the end of the complete fibrinolysis process.