
Figure 4.
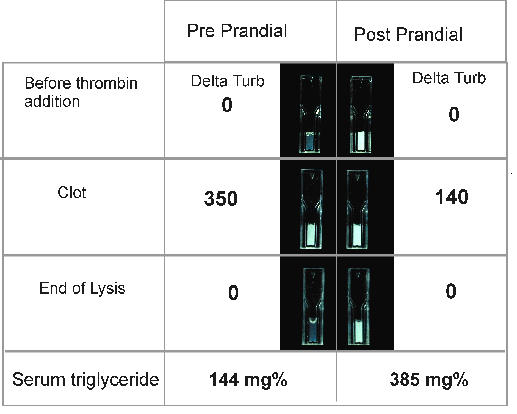
Optical evolution of the turbidity of the euglobulin fraction during the fibrinolysis process. D.Turb: Delta turbidity represents the variation of the signal compared to the start value of the process. Delta turbidity is expressed in arbitrary units. Pre/Post prandial : Total Cholesterol: 319/304 mg%, Triglycerides: 144/385 mg%.