
Figure 5.
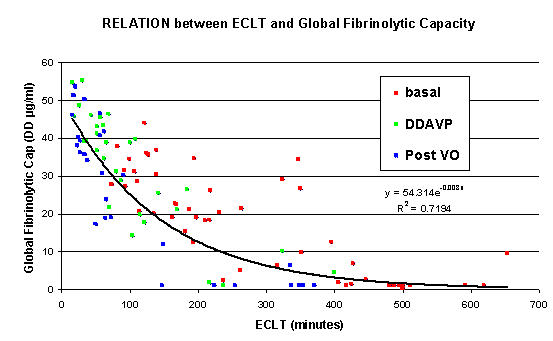
Correlation between the plasma fibrinolytic capacity evaluated by GFC and the ECLT achieved by the semi-automatic method. First group at basal (red) and post venous occlusion (blue) (n = 25). Second group with Desmopresin stimulation [n = 17, basal condition (red), DDAVP 30 min, DDAVP 60 min, DDAVP 120 min (green)].