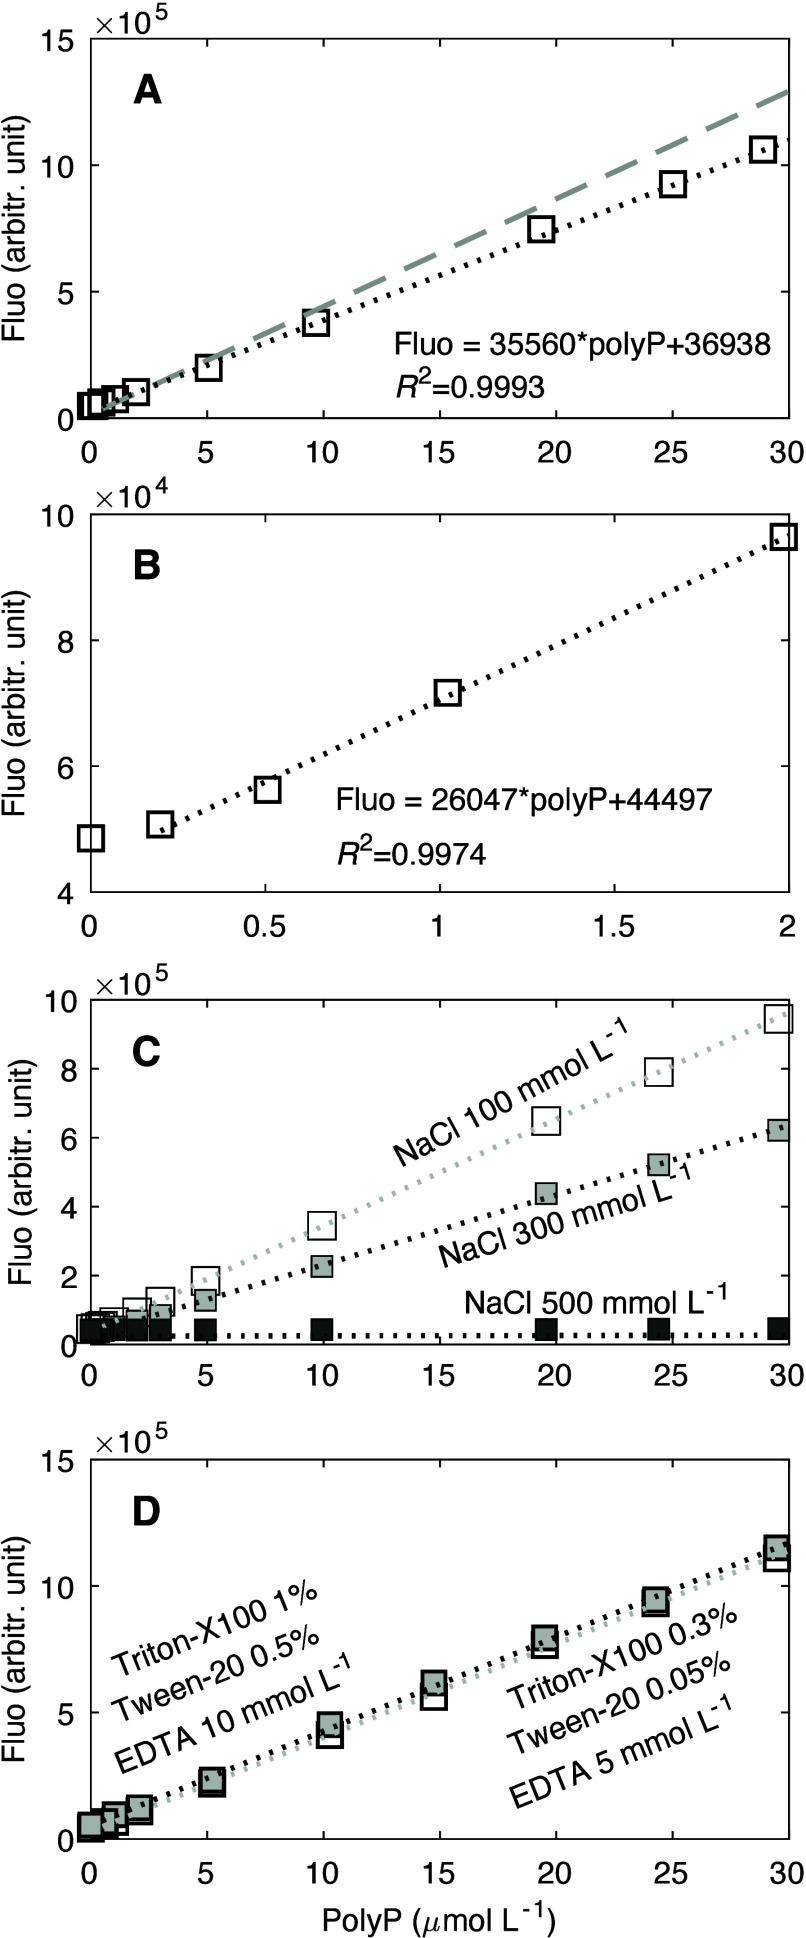
Figure 3.
Responses of JC-D7-polyP fluorescence intensity (Fluo) to the polyP concentrations under the influence of the plankton lysis solution composition. (A) Responses under the composition of the final designed plankton lysis buffer. The dotted line represents the linear curve compared to that without the lysis composition (dashed gray line). (B) Similar to panel A but at a lower range of polyP concentrations, which still shows a linear response, albeit a less sensitive one. (C) Responses under different levels of NaCl [100, 300, and 500 mmol L–1 (see full compositions in Table S5 for tests 6, 2, and 7, respectively)], suggesting that the NaCl concentration affects the linear response. (D) Effects of Triton X-100, Tween 20, and EDTA when the NaCl concentration remains the same (100 mmol L–1), suggesting that these three components of the lysis solution do not affect the JC-D7-polyP linear calibration.

