FIGURE 6.

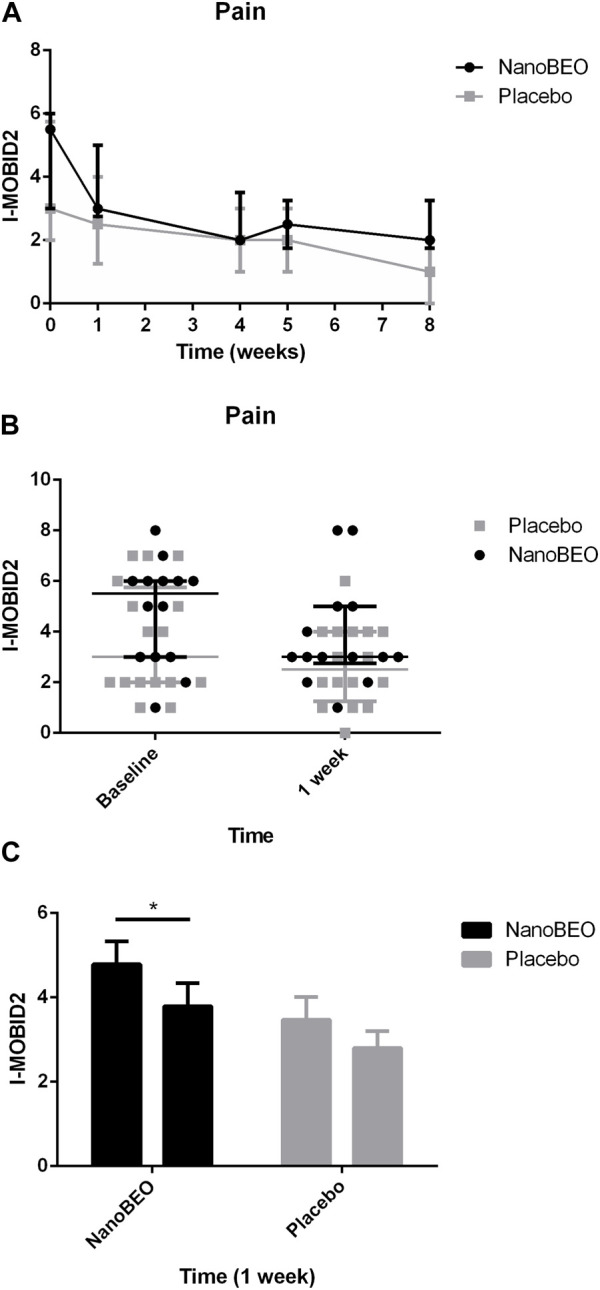
Efficacy of NanoBEO on pain based on the I-MOBID2 scores during treatment and follow-up (A) and as individual data at baseline and after 1 week of treatment (B); data are expressed as the median + IQR. Patients allocated to the NanoBEO group exhibited decreased I-MOBID2 scores than did patients in the placebo group after 1 week; the scores decreased until the end of treatment and increased during the follow-up period but without reaching the baseline value. (C) Statistically significant differences in the effectiveness of NanoBEO (data are expressed as the mean ± SEM; time factor **p = 0.0031; participant matching ****p < 0.0001; NanoBEO baseline vs 1 week *p < 0.05). *p values <0.05 indicate statistical significance. n: NanoBEO = 14, placebo = 16.
