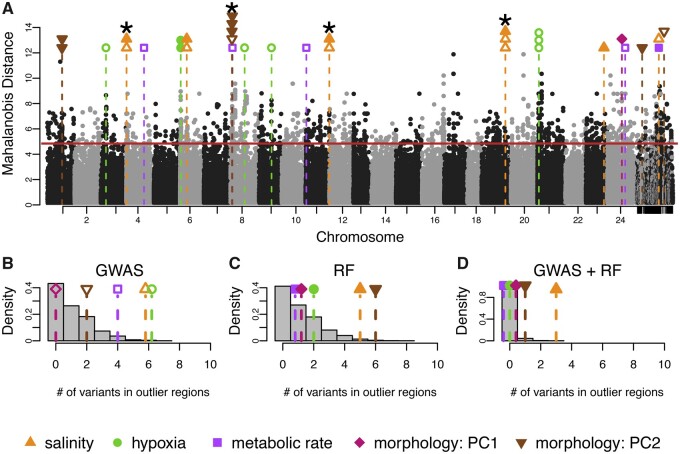
Fig. 4.
Integration of genome-wide scans for signatures of natural selection and genome-wide association mapping of physiological traits. (A) Signatures of selection as represented by Mahalanobis distance across the genome, where alternating black and gray dots represent genetic variants associated with different chromosomes. Horizontal solid red line is the 99% cut-off for the selection scan. Each black or grey point represents a variant and its location in the genome. Unplaced scaffolds are placed on the far right. Vertical dashed lines signify overlap between loci associated with phenotypes and loci showing signatures of selection between BW-native and FW-native populations. The color of the symbol above each line specifies the relevant phenotype. Open shapes are variants identified with GWAS, closed shaped from RF. Where multiple variants are associated with phenotype and fall within a single region showing a signal of natural selection, points are stacked. Variants significant for both GWAS and RF are indicated by *. (B, C, D) Results from 2,500 permutations to test for nonrandom overlap between variants showing signatures of natural selection and phenotype-associated variant from (B) GWAS, (C) RF, and (D) intersection of GWAS and RF. Grey bars represent the distribution of the number of variants expected to overlap from random permutations. Each shape and dashed line are the number of empirically discovered overlaps. Note that some points have been jittered for clarity.

