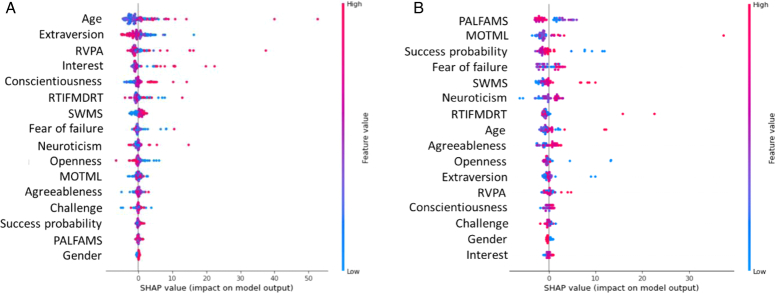
Figure 6.
Summary plot of the distribution of SHAP values for each variable across the entire dataset to identify the most important single variables for the prediction of training performance. (A) SHapley Additive exPlanations (SHAPs) in the student sample. (B) SHAPs in the physician sample. SHAP values constitute the contribution of each of the single variables related to psychomotor skills, personality, and motivation to the prediction of training performance. A positive SHAP value (in pink) indicates that the variable increases training performance, while a negative value indicates that the variable reduces training performance. The magnitude of the SHAP values reflects the strength of the respective variable’s influence on training performance, reflected also by the order of the variables, indicating their impact on prediction – a higher order signifies a greater contribution. [MOTML, motor-screening task - mean latency; PALFAMS, paired associates learning – first attempt memory].

