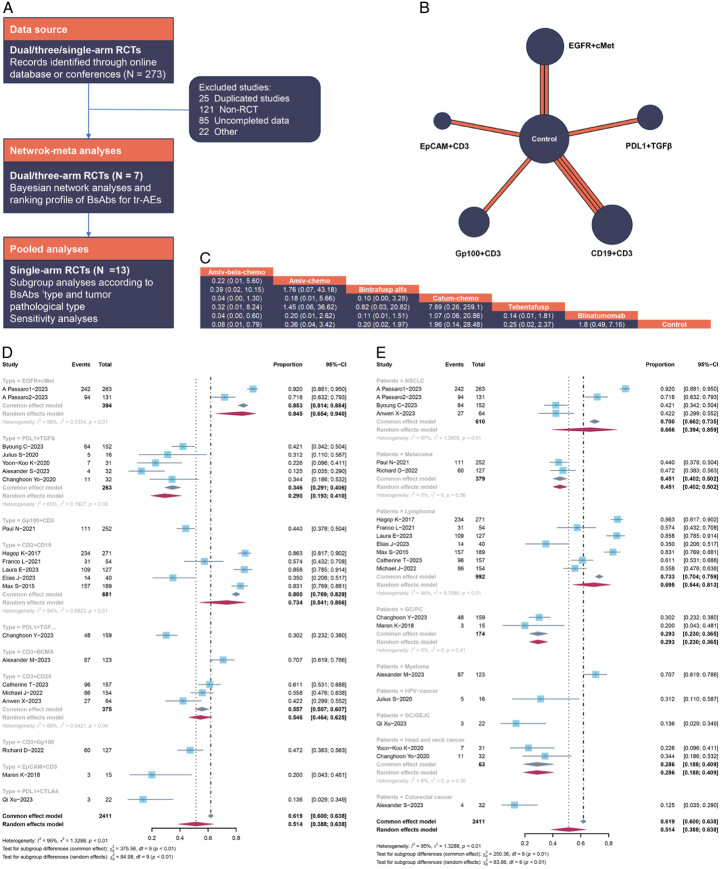
Figure 1.
(A) Flowchart of study selection and analyses. (B) Network plot of seven treatments on tr-AEs. The width of lines is proportional to the number of trials, the circle is the sample size. (C) Multiple comparison for tr-SAE based on network consistency model (OR >1) indicates higher incidence rate of tr-SAE (Amiv-bela-chemo: amivantama plus belazertinibe plus chemotherapy. Amiv-chemo: amivantama plus chemotherapy. Catum-chemo: catumaxomab plus chemotherapy). Contorl including single agent pembrolizumab, ipilimumab, or chemotherapy. Forest Plot of incidence rate of tr-AEs, subgroup analysis according to (D) BsAbs’ type and (E) pathological type of cancer.

