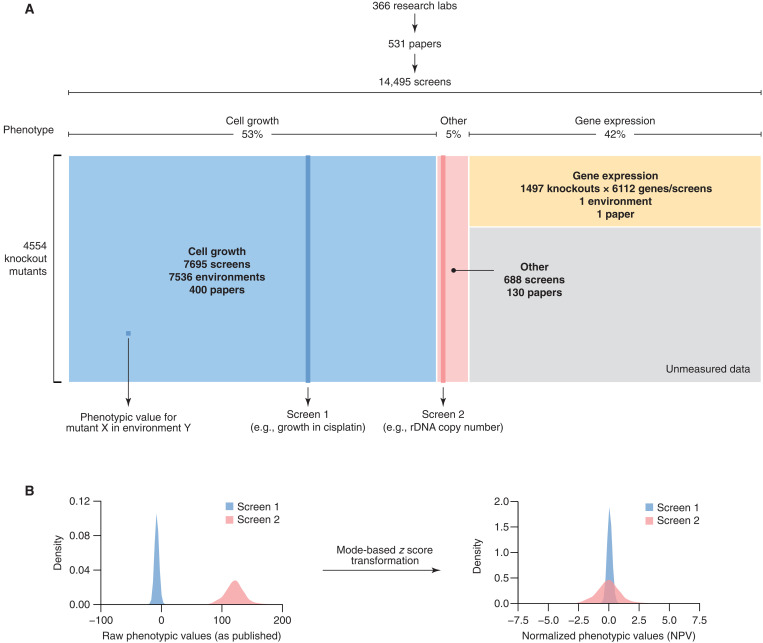
Fig. 1. Yeast Phenome is a data library of published genome-scale screens of the YKO collection.
(A) Yeast Phenome (www.yeastphenome.org) can be thought of as a data matrix where each row is a knockout mutant and each column is a phenotypic screen. The matrix contains phenotypic values obtained by extracting data from 531 papers published by 366 research laboratories. The phenotypes tested by the screens and the experimental conditions/environments, in which the phenotypes were tested (e.g., chemical compounds, pH, temperature, and growth media), were annotated using standard vocabularies. Three major classes of phenotypes (cell growth, gene expression, and other) are highlighted in blue, yellow, and pink, respectively. Gray represents unmeasured data because gene expression profiles were tested for only ~1500 knockout mutants. (B) To facilitate analysis and interpretation, raw phenotypic values (i.e., those released in the publication) were normalized using a modified z score transformation that uses the mode (instead of the mean) and SD from the mode to shift and scale the data.

