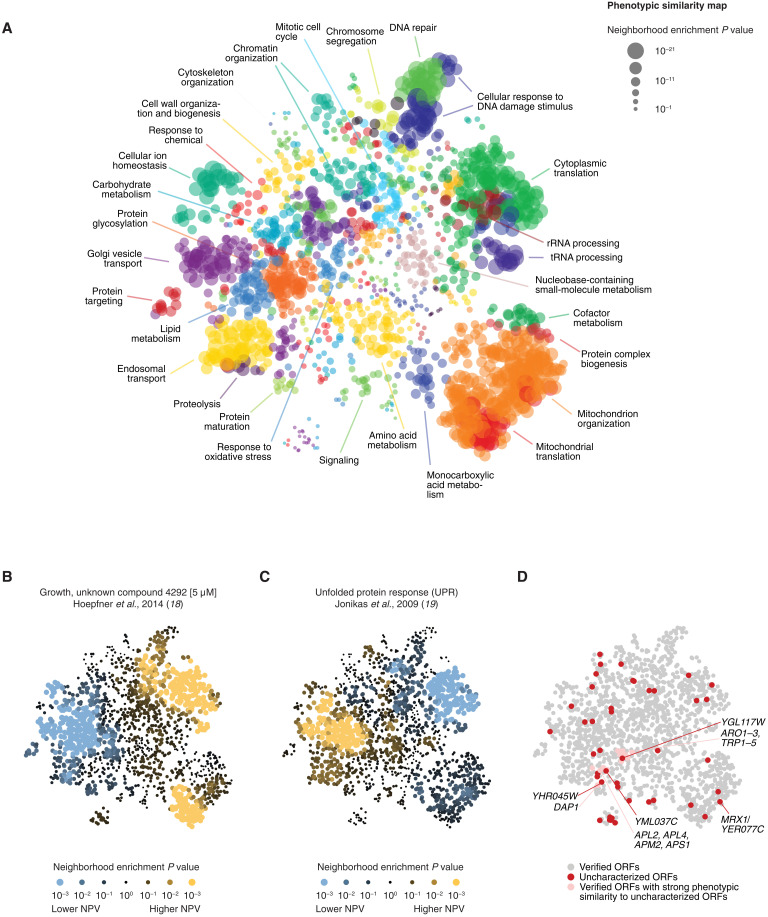
Fig. 3. Phenotypic profiles organize genes by function, help interpret screen results, and validate uncharacterized ORFs.
(A) A phenotypic similarity map was generated by applying Uniform Manifold Aapproximation and Projection (UMAP) to the phenotypic profiles of 1586 genes with a phenotype rate of >1%. The map, where genes with similar phenotypes are placed closer than genes with dissimilar phenotypes, was annotated using SAFE with GO Slim biological process terms. Nodes (genes) are colored on the basis of the GO term with the highest enrichment in their local neighborhoods. The regions with the strongest enrichments are labeled with the corresponding GO terms. (B and C) SAFE was used to annotate the map with NPVs from a chemical genomic screen of the unknown chemical compound 4292 (B) and a reporter screen for the unfolded protein response (UPR) (C). Nodes (genes) are colored on the basis of the average NPV in their local neighborhood relative to random expectation. (D) The phenotypic similarity map shows the distribution of uncharacterized ORFs and suggests hypotheses about their potential functions. Red nodes correspond to 43 uncharacterized ORFs (phenotype rate > 1%, similarity to a verified ORF ρ > 0.17). Pink nodes correspond to verified ORFs with strong phenotypic similarity to uncharacterized ORFs.

