
Fig. 3.
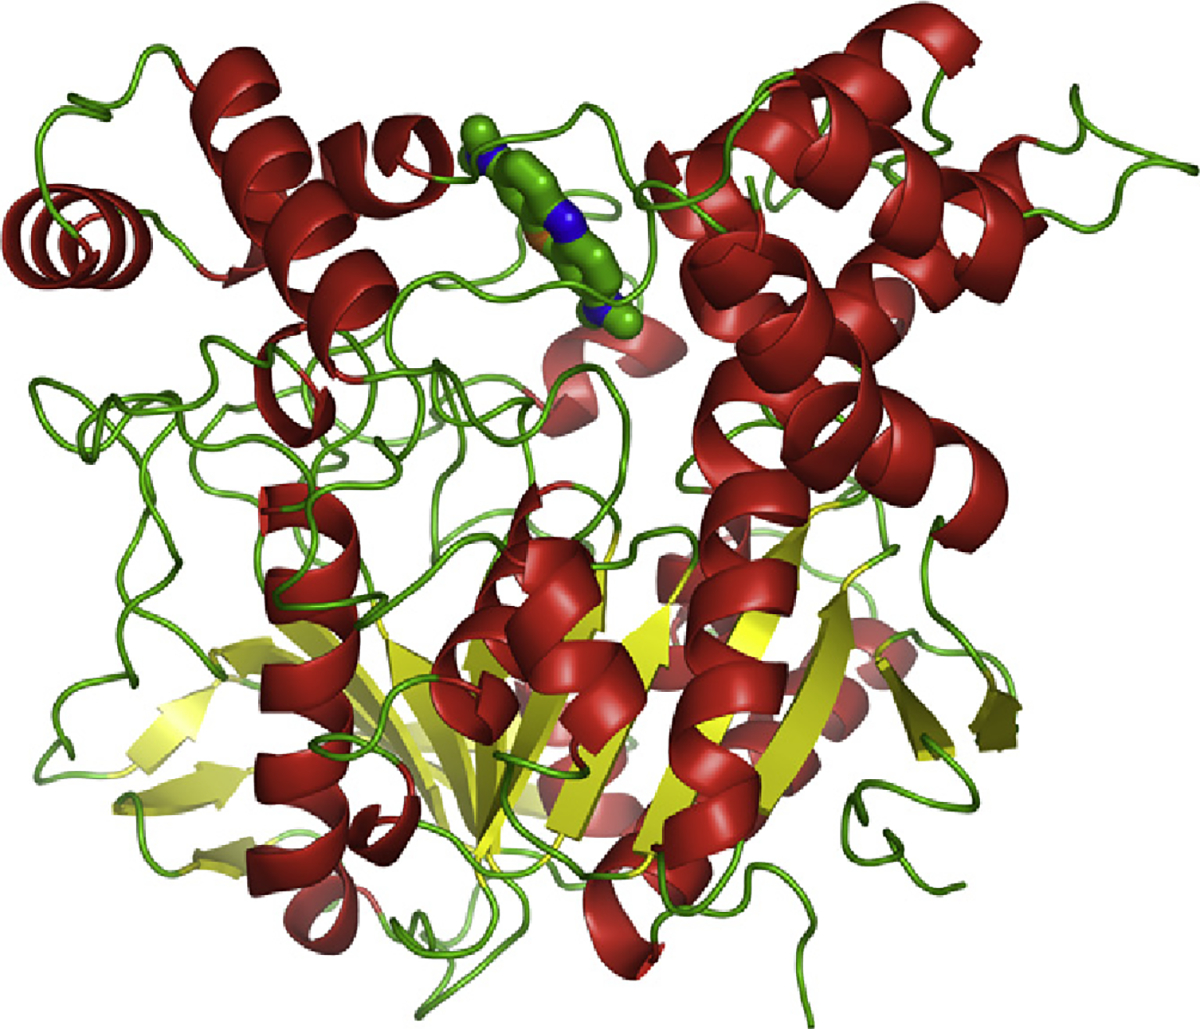
Crystal structure of the MB/TcAChE complex. Cartoon representation with helices in red, sheets in yellow, loops in green [12]. The MB molecule, in stick representation, is seen at the top of the image at the entrance to the active-site gorge.