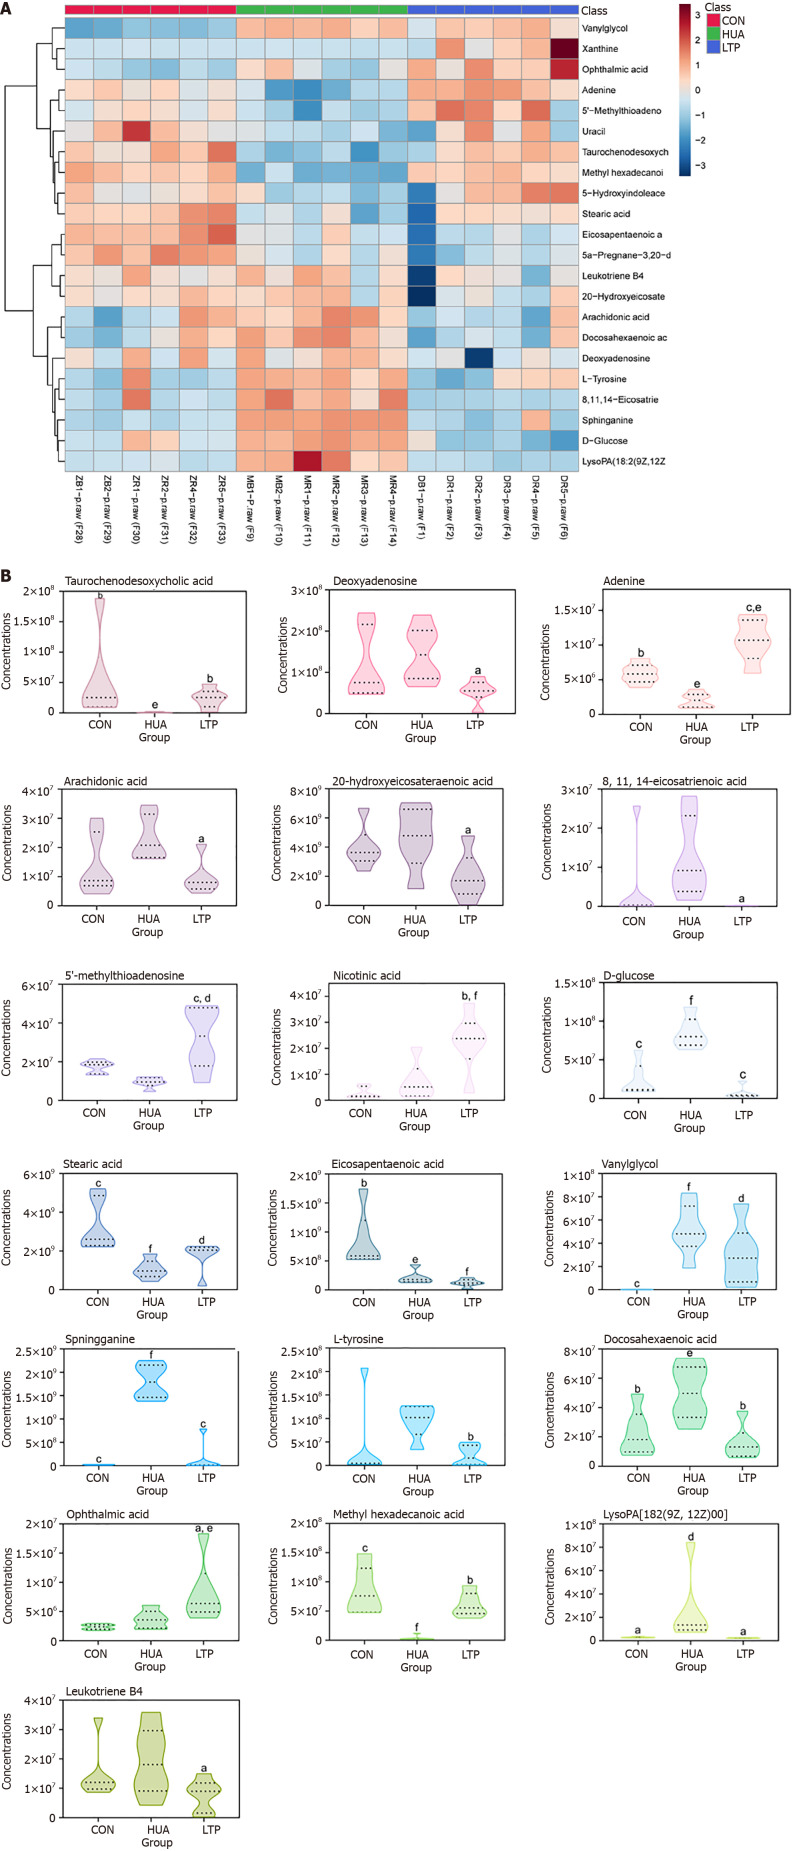
Figure 7.
Effect of leech Poecilobdella manillensis total protein extract on vital metabolites. A: Heatmaps showing the trends in differential metabolites between groups; B: The concentrations of vital metabolites for all groups, assessed through the Kruskal-Wallis ANOVA. Statistical significance is indicated as follows: aP < 0.05 vs hyperuricemia model group (HUA); bP < 0.01 vs HUA; cP < 0.001 vs HUA; dP < 0.05 vs normal control group (CON); eP < 0.01 vs CON; fP < 0.001 vs CON. CON: Normal control group; HUA: Hyperuricemia model group; LTP: Leech Poecilobdella manillensis total protein extract treatment group.

