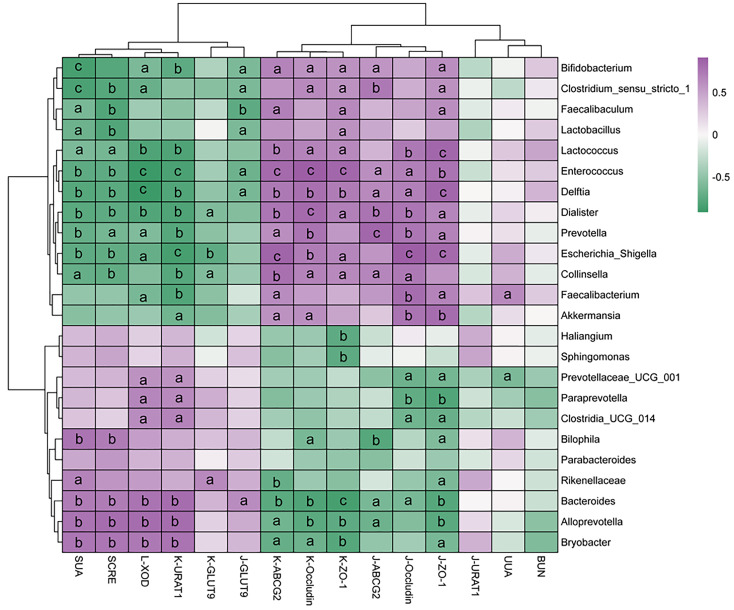
Figure 9.
Correlation analysis between gut microbiota and hyperuricemia-related parameters. The R values are represented by gradient colors, where purple cells indicate positive correlations and green cells indicate negative correlations, respectively. Statistical significance is denoted as follows: aP < 0.05, bP < 0.01, cP < 0.001. BUN: Blood urea nitrogen; UUA: Urinary uric acid; ZO-1: Zonula occludens-1; URAT1: Urate transporter 1; GLUT9: Glucose transporter 9; ABCG2: ATP-binding cassette transporter G2; XOD: Xanthine oxidase; SCRE: Serum creatinine; SUA: Serum uric acid.

