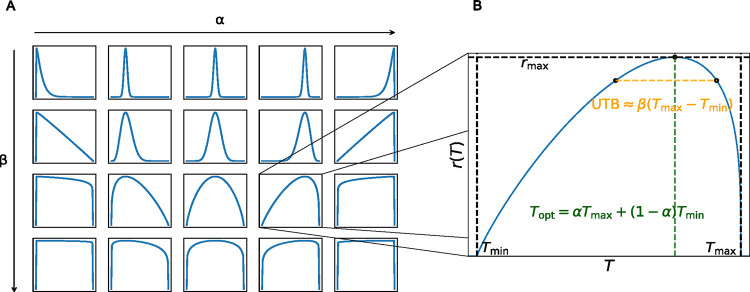
Figure 1. The flexTPC model can describe unimodal thermal performance curves of various shapes.
A. The flexTPC model (Equation 3) has two parameters that determine the shape of the curve: (varying from left to right) corresponds to the position of the temperature optimum relative to the minimum and maximum temperatures while (varying from top to bottom) determines the thermal breadth near the top of the curve. B. Three additional parameters determine how the curve is scaled in the temperature and trait performance axes: the minimum and maximum temperatures ( and , respectively), and the maximum value of the response . The optimum temperature can be at any point between and : its position is determined by parameter . The upper thermal breadth (UTB), defined as the temperature range where , is approximately the product of and the lower thermal breadth where (for details on the accuracy of this approximation, see Methods and Figure S4).

