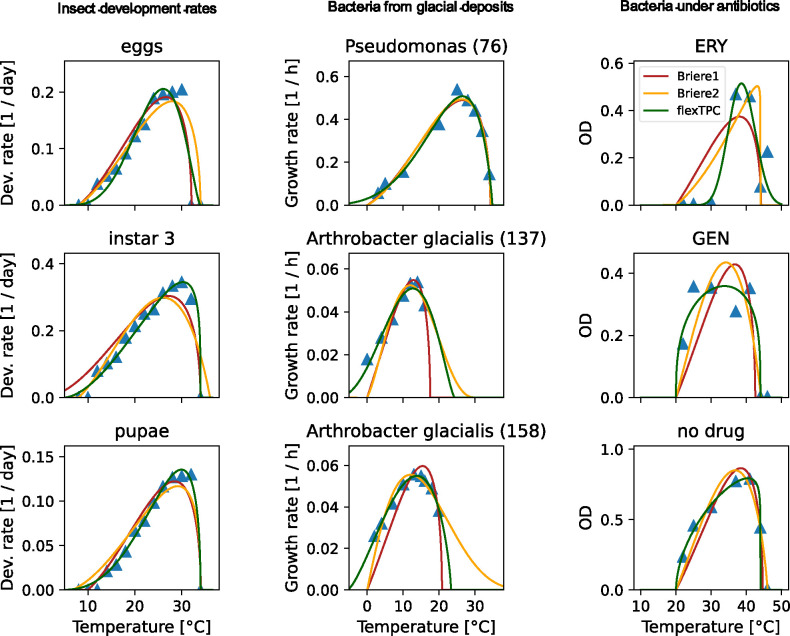
Figure 2. FlexTPC outperforms the Briere1 and Briere2 models in various real-world datasets.
Data (shown as blue triangles) and fitted TPC models (Briere1: red lines, Briere2: yellow lines, flexTPC: green lines) for selected examples from various real-world datasets (botrana, glacierbac and abcoli, see Methods). Left column. Rate of development of various life stages of the grapevine moth Lobesia botrana. A subset of the life stages (eggs, instar 3 and pupae) is shown. Middle column. Growth rate of psychrophile bacterial species (Pseudomonas and Arthrobacter glacialis) isolated from glacial deposits. Right column. Optical density (OD, a proxy for the number of bacteria) of Escherichia coli cultures after 24-hour growth under various antibiotic backgrounds (ERY: erythromycin, GEN: gentamycin, no drug: growth media without antibiotics). The fitted TPC models for all traits in each dataset are shown in Figures S1-S3 in the Supplemental Information.

