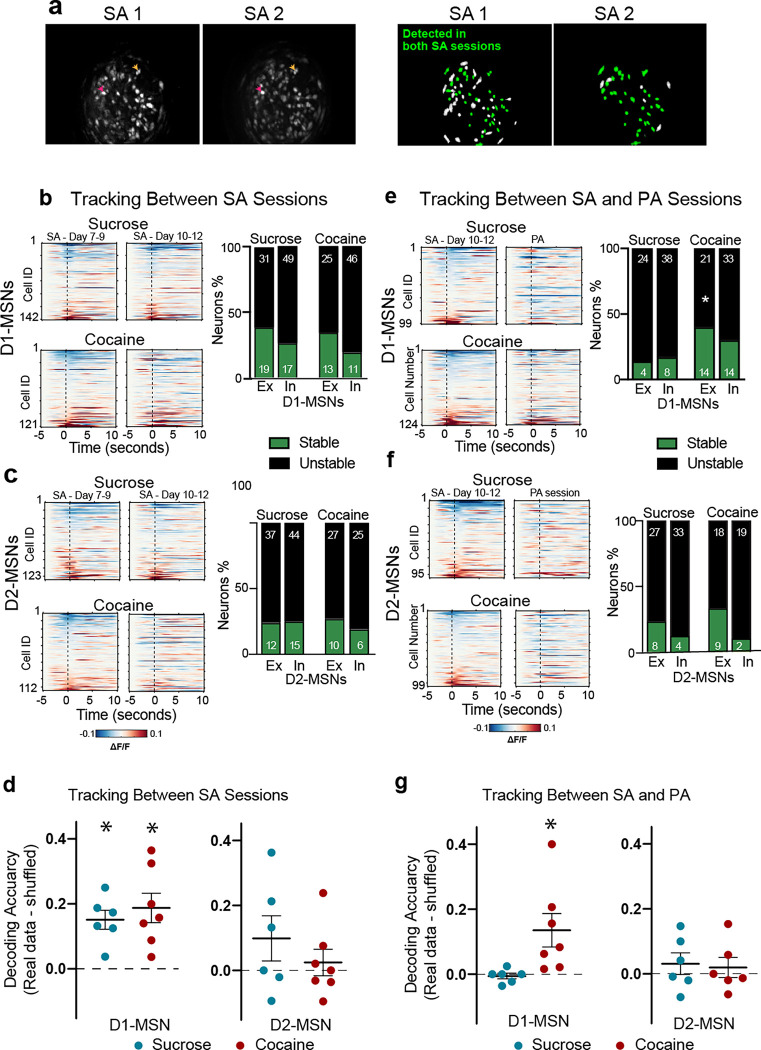
Figure 6. Tracking the same neurons across self-administration (SA) to PA sessions shows a higher stability of responding in the excited D1-MSN subpopulation.
(a) Left: Maximal intensity projections of recordings from two stable self-administration sessions recorded within the same animal, showing similar fields of view; Right: schematic of the spatial footprints of all identified neurons (green+white) in each session. The neurons that were successfully tracked over both sessions are colored green. The neurons that were only visualized in one session but not the other are colored white. Colored arrows point towards to examples of neurons detected in both sessions. (b) Left: Heatmaps representing the mean activity of D1-MSNs longitudinally tracked between two stable cocaine or sucrose self-administration sessions. Each row represents one neuron tracked across both sessions. Right: Bar graphs comparing the stability (green– stable, black– unstable) of excitatory and inhibitory D1-MSNs across two self-administration sessions. (c) Heatmaps representing the mean activity of D2-MSNs longitudinally tracked and stability of neuronal activity between two cocaine or sucrose self-administration sessions (SA 8/9 vs SA 10/11). There were no differences in proportion of stable neuron subpopulations between sucrose and cocaine. (d) Decoding of the second SA session by training on the first SA session. *p<0.05, paired t-test comparing each subpopulation with its shuffled distribution, Table S5 for all t and p values. (e) Heatmaps representing the mean activity of D1-MSNs longitudinally tracked and stability of neuronal activity between two cocaine or sucrose SA and PA sessions. Only stable excited D1-MSNs differed between cocaine and saline (Chi2 and p values in Table S4). (f) Heatmaps representing the mean activity of D2-MSNs longitudinally tracked and stability of neuronal activity between cocaine (lower) or sucrose (upper) self-administration (SA 10/11) and PA sessions. No differences between sucrose and cocaine were found (Chi2 and p values in Table S4). (g) Scatter plot showing the decoding accuracy of SVM model trained on the neuronal activity of D1- or D2-MSNs during the SA session and subsequently used to decode NPs during the PA session. Only cocaine D1-MSNs decoded PA NPs (t and p values in Table S5).

