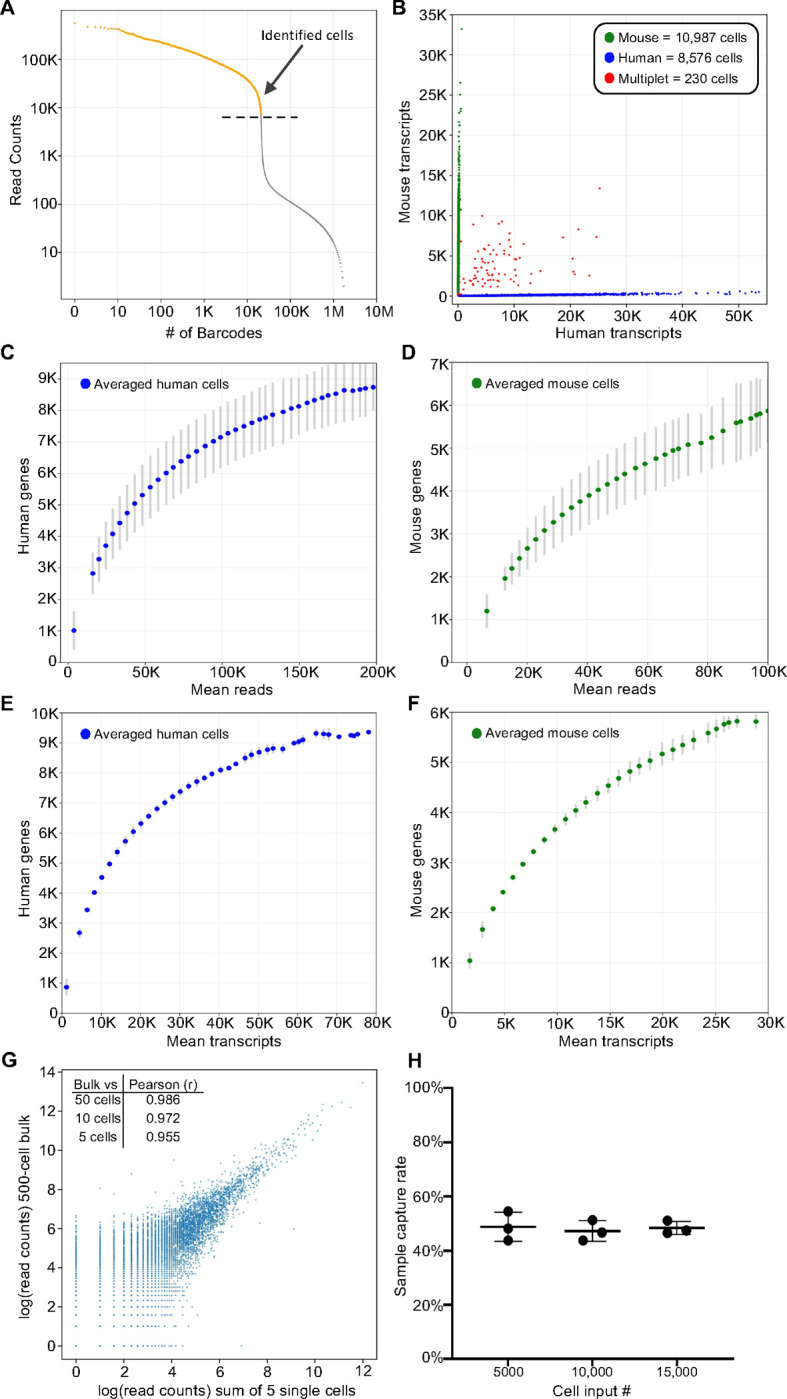
Figure 2. TempO-LINC enables high-throughput single-cell transcriptional profiling.

Mixed human HEK293T and NIH3T3 cells were barcoded with TempO-LINC. Representative data from one of three replicates is presented in (A) and (B). (A) Read ranked barcode plot (knee plot) following demultiplexing of sequencing data. A clear inflection point is observed, above which, barcodes are identified as originating from a cell (shown in orange above the dashed line) (B) Plot showing cells with the number of transcripts mapping to either mouse or human genomes. Barcodes determined to be a multiplet consisting of both mouse and human cells are plotted in red. (C) Human or (D) mouse sequencing saturation curves showing the binned average number of genes detected at a given read depth for human HEK293T and mouse NIH3T3 cells from three replicate experiments with error bars representing the standard deviation. Data points represent the center value of 20,000 (human) or 25,000 (mouse) read bins. Average human (E) or mouse (F) genes detected per cell relative to increasing numbers of transcripts. Bins had a window size of 5,000 transcripts and are averaged across three experiments with standard deviation shown via error bars. (G) Correlation of read counts between a 500-cell bulk (not barcoded) sample and the sum/aggregate of read counts from 5 single cells expression profiled with TempO-LINC. The inset table also shows the Pearson (r) value from the correlation between the 500-cell bulk sample and the sum of either 50, 10 or 5 single HEK293T cells. (H) Sample capture rate plot showing the percentage of cells bioinformatically identified following the TempO-LINC assay. Three replicates were performed for varying initial sample cell input numbers of 5,000, 10,000 or 15,000 mouse NIH3T3 cells. Error bars indicate standard deviation.
