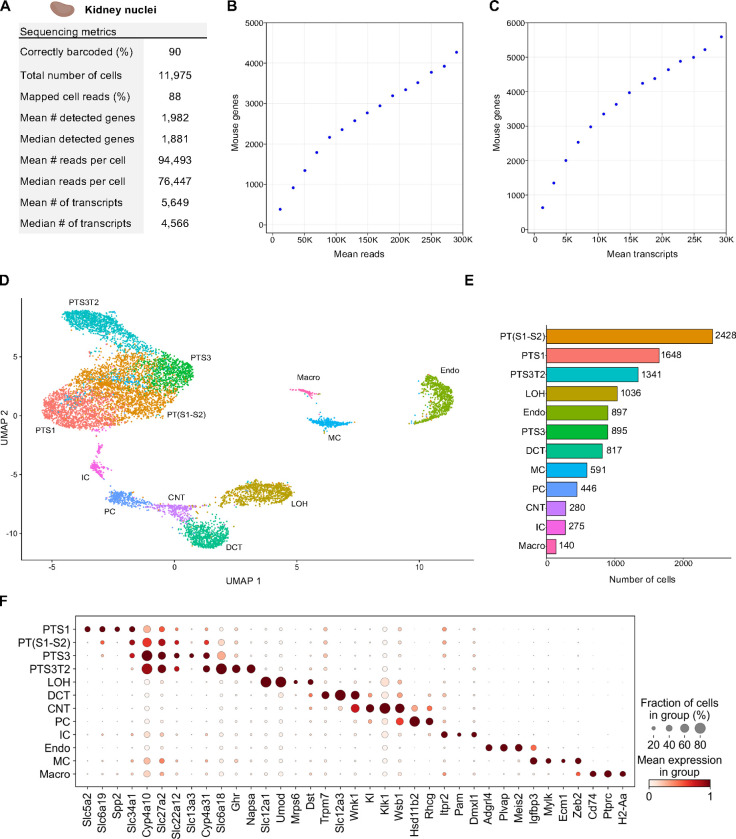
Figure 3. Single Nuclei Profiling of Adult Mouse Kidney.
Nuclei from adult mouse kidney tissue were barcoded with TempO-LINC. (A) Table of key performance metrics following sequencing and demultiplexing of kidney nuclei libraries. (B,C) Sequencing saturation curves showing average number of genes detected per cell with increasing read or transcript depth. (D) 10,974 cells were plotted on a UMAP following unsupervised clustering. 12 distinct populations were identified and annotated using data from the MKA: proximal tubule segment 1 (PTS1), a mixture of proximal tubule segments 1 and 2 (PT(S1-S2), proximal tubule segment 3 (PTS3), proximal tubule segment 3 type 2 (PTS3T2), collecting duct intercalated cells (IC), principal cells (PC), connecting tubule (CNT), distal convoluted tubule (DCT), loop of Henle (LOH), mesangial cells (MC), endothelial cells (Endo) and macrophages (Macro). (E) Bar plot graph showing the number of cells within each population of clustered cells. (F) The expression level of representative kidney cell type biomarkers was examined for each of the 12 populations identified following unsupervised clustering.

