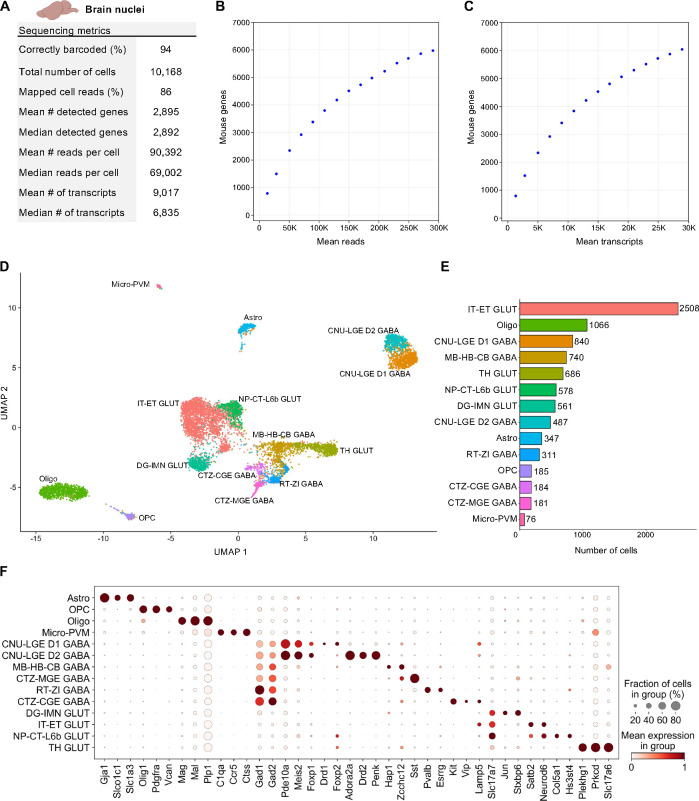
Figure 4. Single Nuclei Profiling of Adult Mouse Brain.
Nuclei from adult mouse brain tissue were barcoded with TempO-LINC. (A) Table of key performance metrics following sequencing and demultiplexing of brain nuclei libraries. (B,C) Sequencing saturation curves showing average number of genes detected per cell with increasing read or transcript depth. (D) 8,750 cells were plotted on a UMAP following unsupervised clustering. 14 distinct populations were identified and annotated using data from the Allen Brain Institute (ABI): perivascular macrophages (micro-PVM), astrocytes (Astro), oligodendrocytes (Oligo), oligodendrocyte precursor cells (OPC), MB-HB-CB GABA neurons, RT-ZI GABA neurons, CTZ-CGE GABA neurons, CTZ-MGE GABA neurons, CNU-LGE D1 GABA neurons, CNU-LGE D2 GABA neurons, IT-ET GLUT neurons, NP-CT-L6b GLUT neurons, TH GLUT neurons and DG-IMN GLUT neurons. (E) Bar plot graph showing the number of cells within each population of clustered cells. (F) The expression level of representative braincell type biomarkers was examined for each of the 14 cell classes identified following unsupervised clustering. Gad1 and Gad2 are seen broadly expressed across GABA neurons as would be expected based on their molecular function. Similarly, Slc17a7 and Slc17a6 (human VGLUT1 and VGLUT2) are implicated in glutamate transport and mark multiple populations of glutamatergic neurons.

