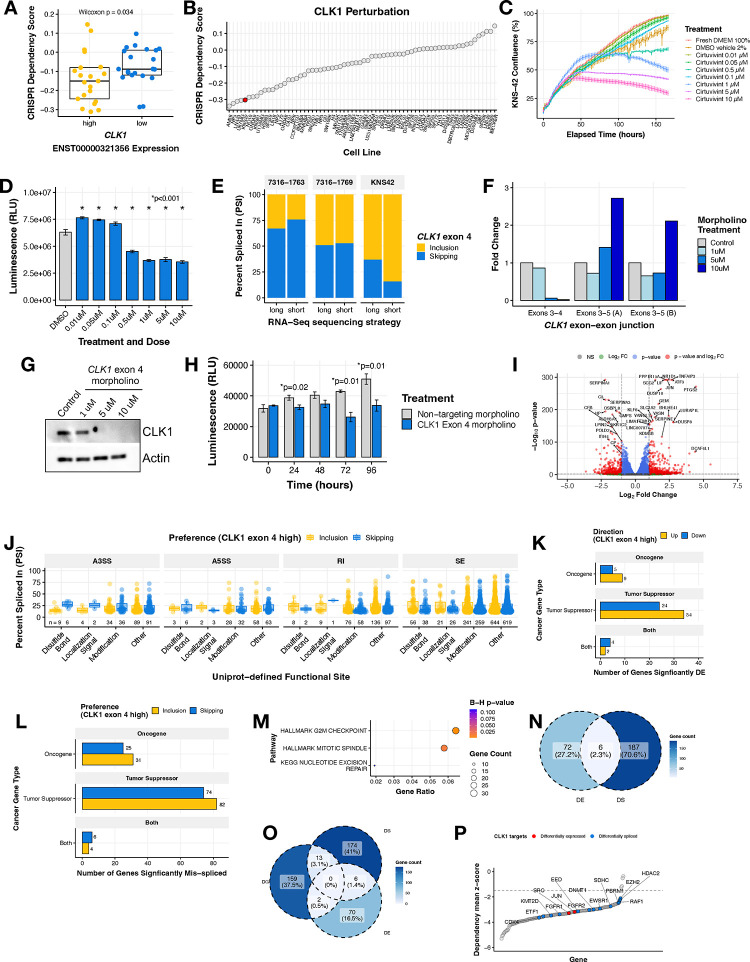
Figure 4. CLK1 aberrant splicing contributes to oncogenesis in brain tumor cell lines.
(A) Boxplot of DepMap dependency scores stratified by high or low CLK1 exon 4 containing transcript expression in brain tumor cell lines. Wilcoxon p-value shown. (B) Ranked dotplot of DepMap dependency scores in brain tumor cell lines with pediatric line KNS-42 highlighted in red. (C) Proliferation of KNS-42 cells treated with increasing concentrations of pan-DYRK/CLK1 inhibitor Cirtuvivint over six days. (D) Day 6 cell viability of KNS-42 cells treated with increasing concentrations of Cirtuvivint. Stars denote Bonferroni-adjusted p-values following pairwise Student’s t-tests. (E) Stacked bar plots of the percent inclusion and skipping of CLK1 exon 4 transcripts in patient-derived cell lines (7316–1763 and 7316–1769 from the CBTN) and KNS-42 (commercial) derived using either long (ONT) or short RNA-seq strategies. (F) Barplot showing the RNA expression fold-change in cells treated with control morpholino or morpholino targeting the CLK1 exon 3–4 junction or exon 3–5 junction (G) Western blot of CLK1 with increasing morpholino treatment of 1, 5, and 10 μM. (H) Cell viability of cells treated with CLK1 exon 4 morpholino or non-targeting morpholino. Stars denote within-time paired Student’s t-tests. (I) Volcano plot illustrating genes differentially-expressed in KNS-42 cells treated with CLK1 exon 4 targeting morpholino compared to cells treated with non-targeting morpholino. (J) Boxplot of |ΔPSI| of significantly differential splicing events comparing KNS-42 cells treated with CLK1 exon 4 targeting morpholino vs. non-targeting morpholino (ΔPSI ≥ |.10|, p-value < 0.05, FDR < 0.05). Plot shows Uniprot-defined functional sites which are gained/lost categorized by splicing case (A3SS, A5SS, RI, and SE). (K) Barplots displaying number of differentially expressed (DE) genes or (L) differentially spliced (DS) genes affecting functional sites categorized by gene family. (M) Over-representation analysis using ClusterProfiler of DS cancer genes that result in gain/loss of functional sites. (N) Venn diagram depicting overlap of DS and DE genes from K and L (O) Venn diagram depicting overlap of DS and DE genes from K and L and significant (Wald FDR < 0.05, z-score < −1.5) essential genes identified in matched CBTN HGG cell lines through CRISPR dependency experiments from the Childhood Cancer Model Atlas (CCMA v3). (P) Ranked dotplot of significant CRISPR gene dependency mean z-scores for pediatric HGG cell lines with CLK1 expression and splicing-based target genes highlighted in red and blue respectively.

