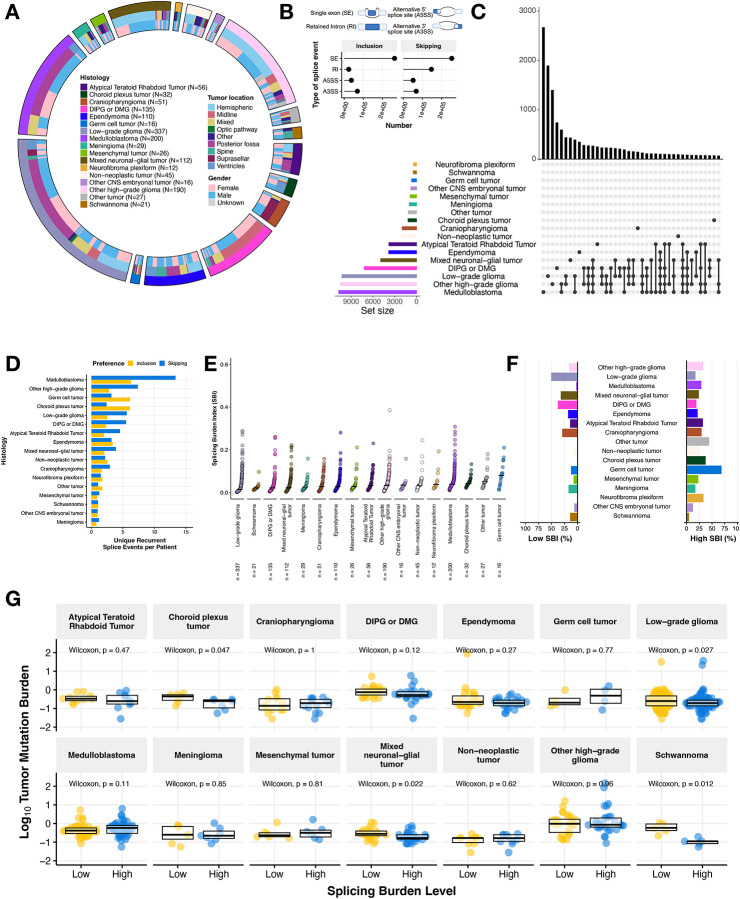
Figure 1: Pediatric brain tumors display heterogeneous global patterns of aberrant splicing.
(A) Circos plot of CNS tumors used in this study, categorized by histology, tumor location, and reported gender. Non-neoplastic tumors consist of benign tumors and/or cysts. (B) Lollipop plot illustrating the total number of splicing events across the cohort, classified by splicing type (SE: single exon, RI: retain intron, A3SS: alternative 3’ splice site, A5SS: alternative 5’ splice site). (C) UpsetR plot of recurrent differential splicing events that prefer exon skipping (N ≥ 2 of samples within a histology). (D) Barplots of the number of histology-specific recurrent events per patient. Histologies are reverse ordered by total number of unique events (skipping + inclusion). (E) Cumulative distribution plots of splicing burden index (SBI) by histology. (F) Barplots displaying percent of tumors with high (≥ third quantile) and low (≤ first quantile) SBI in each histology. (G) Boxplots of tumor mutation burden (TMB, log10) stratified by high or low SBI by histology. Withinhistology Wilcoxon p-values are shown. All boxplots represent the 25th and 75th percentile and the bar represents the median.

