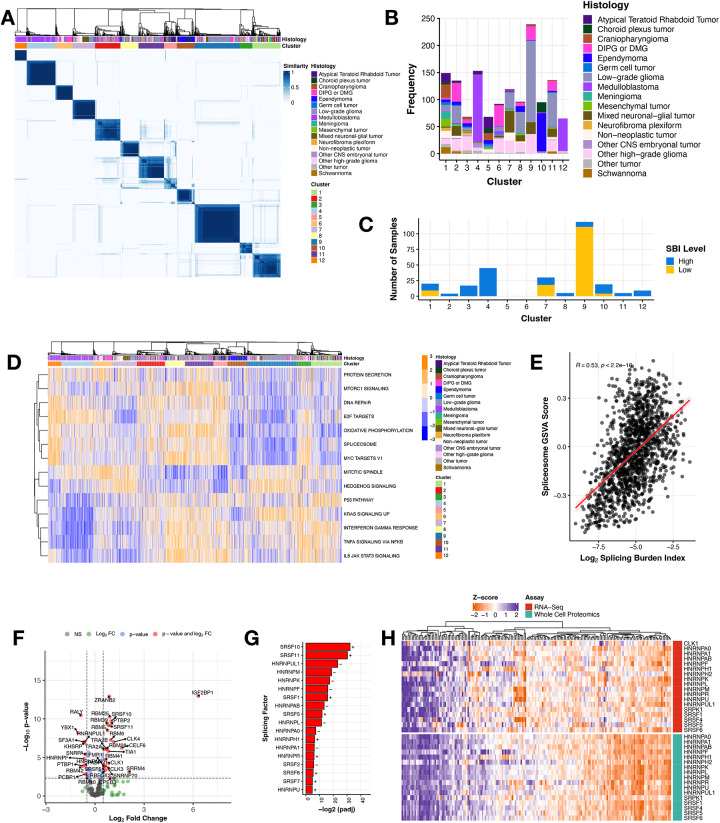
Figure 2: Splicing drives novel biological clusters and splicing burden differentiates key splicing factors in pediatric high-grade gliomas.
(A) Consensus clustering heatmap of PSI values for all expressed genes (junction read counts ≥ 10) with a multi-modal distribution across tumors (see Methods). (B) Stacked barplot showing histology sample membership in each cluster. (C) Stacked barplot of the number of tumors with high or low SBI within each cluster. (D) Heatmap of top cancer-related enriched pathways by cluster (GSVA scores represented by blue/orange color). (E) Pearson’s correlation scatterplot of log2 SBI and KEGG Spliceosome GSVA score (R = 0.53, p-value < 2.2e−16). (F) Volcano plot illustrating the expression direction of splicing factor genes in HGGs with high SBI compared to those with low SBI (NS = not significant, FC = fold change, colored dots represent log2FC > |.5| and/or Benjamini and Hochberg adjusted p-value < 0.05). (G) Barplot presenting members of the hnRNP and SRSF families of primary splicing factors that are differentially expressed (Benjamini and Hochberg adjusted p-value < 0.05) with directionality (+ or −). (H) Heatmap displaying these splicing factors and known regulators CLK1 and SRPK1 for all pediatric brain tumors with available RNA-seq and whole-cell proteomics data from the CPTAC portal.

