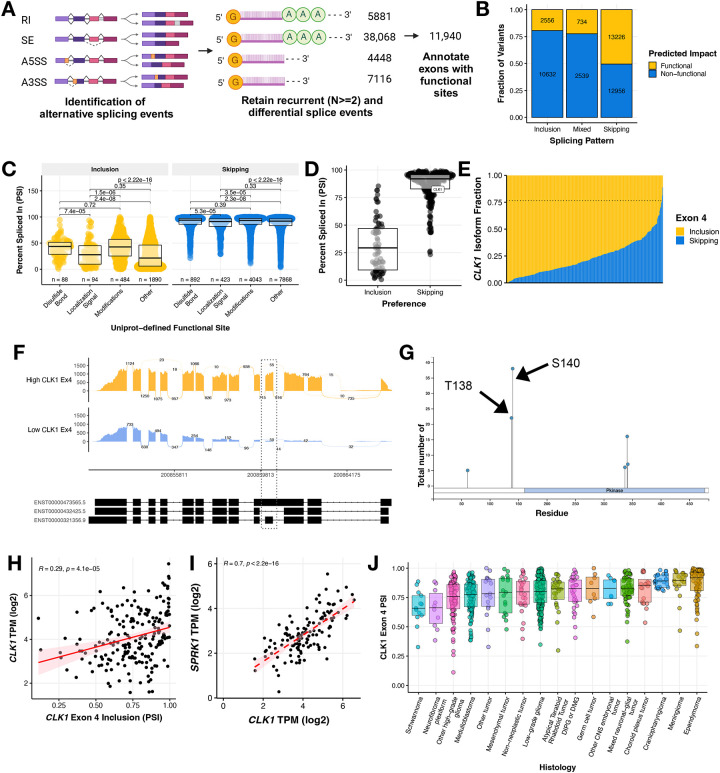
Figure 3: Recurrent splicing aberrations alter known proteomic functional sites in pediatric high-grade gliomas, including phosphorylation sites in splicing regulator protein kinase CLK1.
(A) Workflow to identify 11,940 differential exon-level splicing events that alter UniProt-defined functional sites in HGGs. (B) Stacked bar plots showing the fraction of exon inclusion, skipping, or mixed splicing events categorized by predicted impact. (C) Boxplots of splice events resulting from gain or loss of functional sites categorized by UniProt annotation. Wilcoxon between-group p-values are shown. (D) Boxplots of predicted functional splice events affecting known kinases with CLK1 highlighted. (E) Stacked barplot of CLK1 exon 4 inclusion and skipping isoform fraction in HGGs. Dotted line represents the mean PSI of 0.7653. (F) Sashimi plot of two representative tumor samples with either high (BS_HRJ9145M) or low (BS_XM1AHBDJ) CLK1 exon 4 inclusion. (G) PhosphositePlus46 CLK1 protein visual highlighting the two phosphorylation binding sites in exon 4. (H) Pearson’s correlation scatter plot of CLK1 exon 4 PSI and RNA expression in HGG tumors (R = 0.29, p = 4.1e−5). (I) Pearson’s correlation scatter plot of CLK1 exon 4 PSI and SRPK1 RNA expression in HGG tumors (R = 0.7, p = 2.2e−16). (J) Boxplot of CLK1 Exon 4 PSI levels across all primary pediatric brain tumors. All boxplots represent the 25th and 75th percentile and the bar represents the median.

