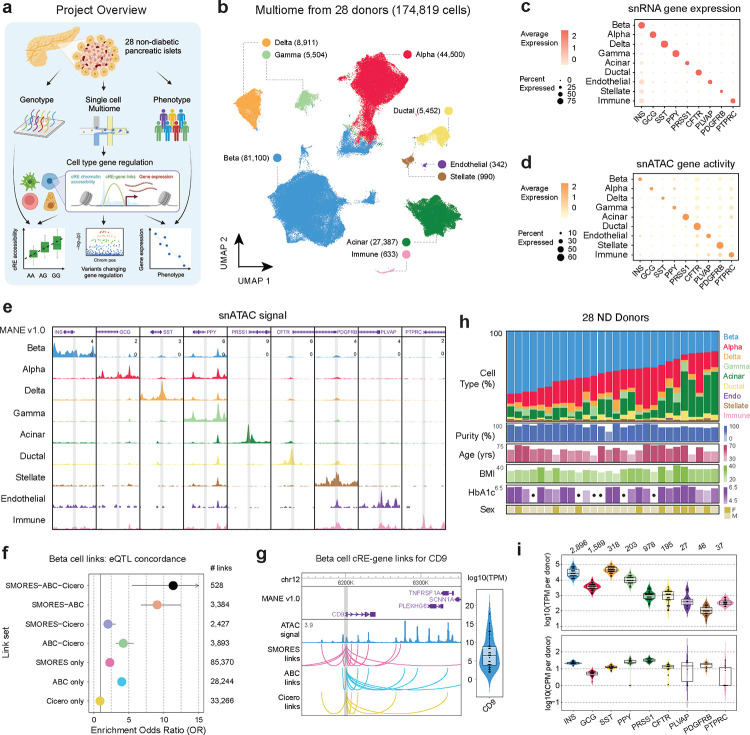
Figure 1. Mapping gene regulation in non-diabetic pancreatic islets with multimodal snRNA-seq and snATAC-seq.
a) Project overview, 28 pancreatic islets were isolated from non-diabetic donors and genotyping and single cell Multiome was run on each. These were then used to map cell type gene regulation and how donor genotype and phenotype as well as disease risk alter regulation. Created with BioRender.com. b) UMAP projection of 174,819 barcodes post QC filtering and doublet removal. Dimensionality reduction was performed on both modalities separately and then a joint representation was created with the weighted nearest neighbors26 method. c) Per-cell type gene expression of islet marker genes. The dot color represents the average expression in a cell type, and the dot size represents what percent of cells in the cell type have non-zero expression. d) Per-cell type gene activity of islet marker genes. The dot color represents the average gene activity in a cell type, and the dot size represents what percent of cells in the cell type have non-zero gene activity. e) ATAC signal tracks for all cell type marker genes. Each marker gene window is a 6kb region centered on the marker gene transcription start site (TSS), and peak heights are standardized across all cell types for each region. f) Enrichment of eQTLs with the same target gene prediction in the cREs from sets of links predicted by different combinations of methods. g) Beta cell cRE-gene links between CD9 and all cREs predicted to regulate it, separated by prediction method. Right inlay shows the range of per-donor ‘pseudo’-bulk beta cell TPM values for CD9. h) Distribution of cell type proportions and phenotype information across all 28 donors, where each column represents a donor. The dots in HbA1c measurements indicate donors with missing measurements. i) Per-donor ‘pseudo’-bulk TPM and CPM values for each cell type marker gene, for the relevant cell type. Violin plots are colored based on the cell type the gene is a marker for.

