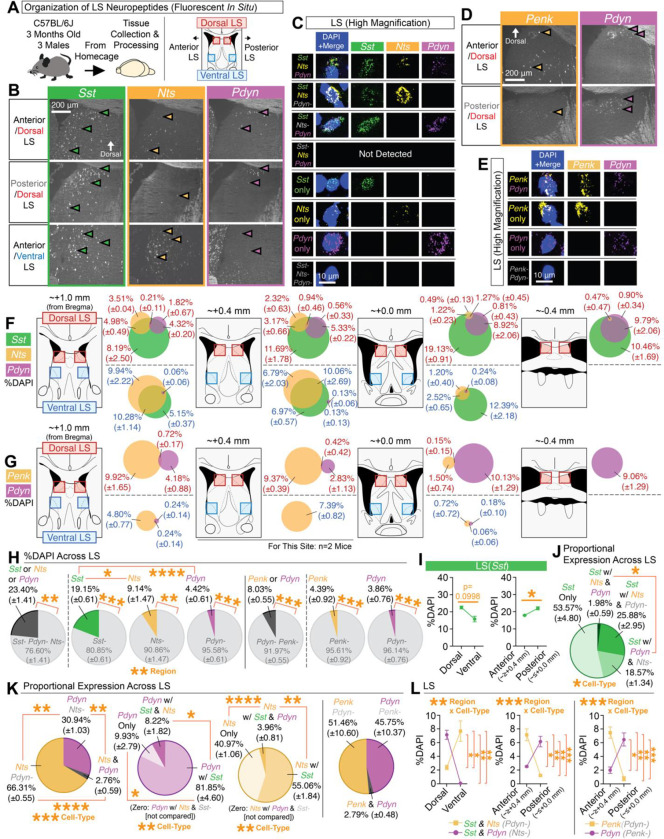
Figure 1. Topographic mapping of neuropeptides reveals Pdyn as a distinct dorsal subset of Sst cells.
(A) Multiplex fluorescent in situ hybridization was used to map the neuropeptides Sst, Nts, Penk, and Pdyn in the LS across its dorsal-ventral and anterior-posterior regions. (B) Representative coronal images of in situs for Sst, Nts, and Pdyn at different regions of the LS. (C) High magnification representative images of individual cells for each of the different cell-types detected for Sst, Nts, and/or Pdyn. (D) Representative coronal images of in situs for Penk and Pdyn at different regions of the LS. (E) High magnification representative images of individual cells for each of the different cell-types detected for Penk and/or Pdyn. (F) Mouse atlas images and venn diagrams [%DAPI (±SEM)] depicting the extent of overlap of Sst, Nts, and/or Pdyn at each quantified region in the LS. (G) Mouse atlas images and venn diagrams [%DAPI (±SEM)] depicting the extent of overlap of Penk and/or Pdyn at each quantified region in the LS. (H) Average expression (%DAPI) of Sst, Nts, Pdyn, and/or Penk across all quantified regions of the LS. Main effect of cell-type (ANOVA; significant Tukey’s post-hocs) for comparisons of Sst-positive, Nts-positive, and Pdyn-positive cells. Significant paired t-tests denote comparisons of positive vs. negative expression for each cell-type. (I) Average expression (%DAPI) of Sst in the dorsal vs. ventral LS and anterior vs. posterior LS (significant paired t-test). (J) The average proportion (derived from %DAPI) of each subtype for all Sst cells across all quantified regions of the LS (ANOVA: main effect of cell-type; significant Bonferroni post-hoc). (K) The average proportion (derived from %DAPI) of each subtype across all quantified LS regions for all Nts and/or Pdyn cells (ANOVA: main effect of cell-type; significant Tukey’s post-hocs), all Pdyn cell-types (ANOVA: main effect of cell-type; significant Tukey’s post-hocs), all Sst, Nts, and/or Pdyn cells (ANOVA: main effect of cell-type; significant Tukey’s post-hocs), and all Penk and/or Pdyn cells. (L) Comparisons of the average expression (%DAPI) of Sst-Nts and Sst-Pdyn cells in the dorsal vs. ventral and anterior vs. posterior regions of the LS, and Penk or Pdyn cells in the anterior vs. posterior regions of the LS (ANOVAs: significant interactions of region x cell-type; significant Bonferroni post-hocs). For the entire figure, all data are shown as mean (±SEM), and for all statistics: *=p<0.05; **p<0.005, ***p<0.0005; ****p<0.00005.

