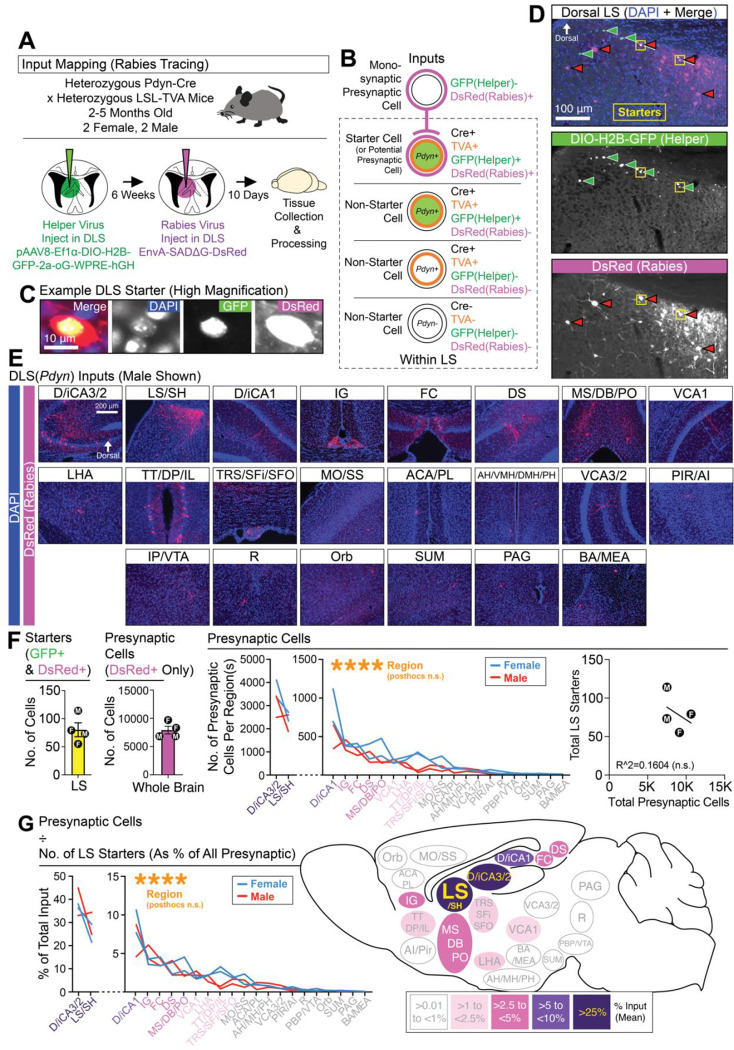
Figure 2. DLS(Pdyn) neurons receive dense DHPC input.
(A) Monosynaptic rabies tracing was used to identify afferents to DLS(Pdyn) cells from across the brain. (B) A schematic shows the logic used for identifying starter and presynaptic cells. (C) High magnification image of a starter cell in the DLS. (D) Representative coronal images showing starter cells and monosynaptic labeling in the DLS. (E) Representative coronal images of brain-wide inputs to DLS(Pdyn) cells. (F) The number of starter cells detected in the DLS, the total number and per region of presynaptic inputs (ANOVA; main effect of region), and a plot correlating the number of starters with the total number of presynaptic cells. (G) A percentage of total input for each region(s) is calculated and summarized in a sagittal schematic (ANOVA; main effect of region). Outside of the individual data points plotted for each brain region(s), all data in the figure are shown as mean (±SEM); no significant comparisons noted in figure. Abbreviations (see methods for additional details): “D/iCA3/2” (dorsal/intermediate CA3/2 of the dorsal hippocampus), “LS/SH” (lateral septum and/or septohippocampal area within the LS), “D/iCA1” (dorsal/intermediate CA1 of the dorsal hippocampus), “IG” (indusium griseum), “FC” (fasciola cinerea), “DS” (dorsal subiculum), “MS/DB/PO” (medial septum, diagonal band, and/or preoptic area), “VCA1” (ventral CA1), “LHA” (lateral hypothalamic area, which could also include the tuberal area), “TT/DP/IL” (tenia tecta, dorsal peduncular, and/or infralimbic areas), “MO/SS” (motor and/or somatosensory cortices), “ACA/PL” (anterior cingulate and/or prelimbic areas), “AH/VMH/DMH/PH” (anterior hypothalamus, ventromedial hypothalamus, dorsomedial hypothalamus, and/or posterior hypothalamus), “VCA3/2” (ventral CA3/2), “PIR/AI” (piriform area and/or agranular insular area), “IP/VTA” (interpeduncular nucleus and/or ventral tegmental area), “R” (raphe), “ORB” (orbital area), “SUM” (supramammillary nucleus), “PAG” (periaqueductal gray), “BA/MEA” (basal regions of the amygdala and/or medial amygdala).

