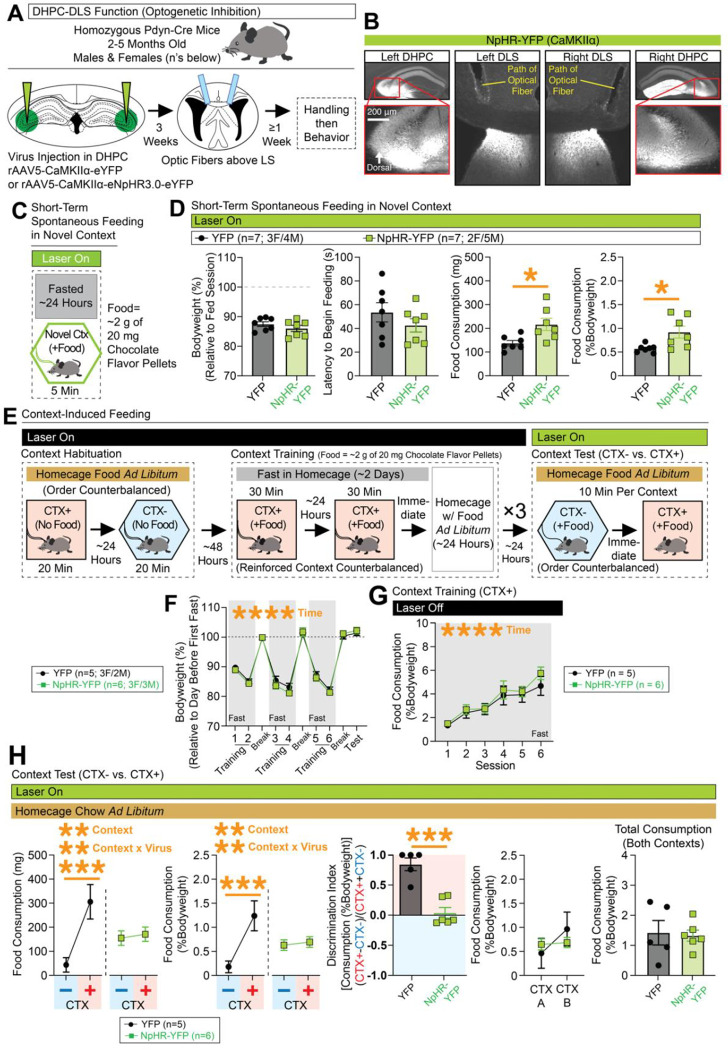
Figure 6. Inhibition of DHPC inputs in the DLS disrupts expression of context-specific expression food consumption.
(A) Pdyn-Cre mice were injected with NpHR-expressing or control virus in the DHPC and optic fibers were placed above the DLS. (B) Representative coronal images with NpHR-YFP expression in the DHPC/DLS and optic tracts above the DLS. (C) Behavioral design for testing spontaneous feeding of fasted mice in a novel context. Optogenetic inhibition occurred throughout test. (D) Leftmost graph shows bodyweight (%) relative to the day before testing. The next graph shows latency (s) to begin chewing food. The final two graphs show the total amount of food consumed at the end of the test (in mg and %Bodyweight, significant unpaired t-tests for both. (E) Behavioral design for context-conditioned feeding. Optogenetic inhibition occurred during the context test phase. (F) Bodyweight (%) across training and testing (ANOVA: main effect of time). (G) Food consumption (%Bodyweight) at each training session (ANOVA: main effect of time). (H) At test, food consumption (mg and %Bodyweight) is plotted for the nonreinforced (CTX−) and reinforced (CTX+) contexts (for both mg and %Bodyweight, ANOVAs: main effects of context and context x virus interactions, significant Bonferroni post-hocs for comparing CTX− vs. CTX+ in controls). A discrimination index was generated based on consumption at test (from %Bodyweight; significant unpaired t-test). Final two graphs plot consumption (%Bodyweight) across contexts A and B at test (whether CTX+ or CTX−) and total consumption (%Bodyweight; unpaired t-test shown) for both contexts at test. For the entire figure, all data are shown as mean (±SEM), and for all statistics: *=p<0.05; **p<0.005, ***p<0.0005; ****p<0.00005.

