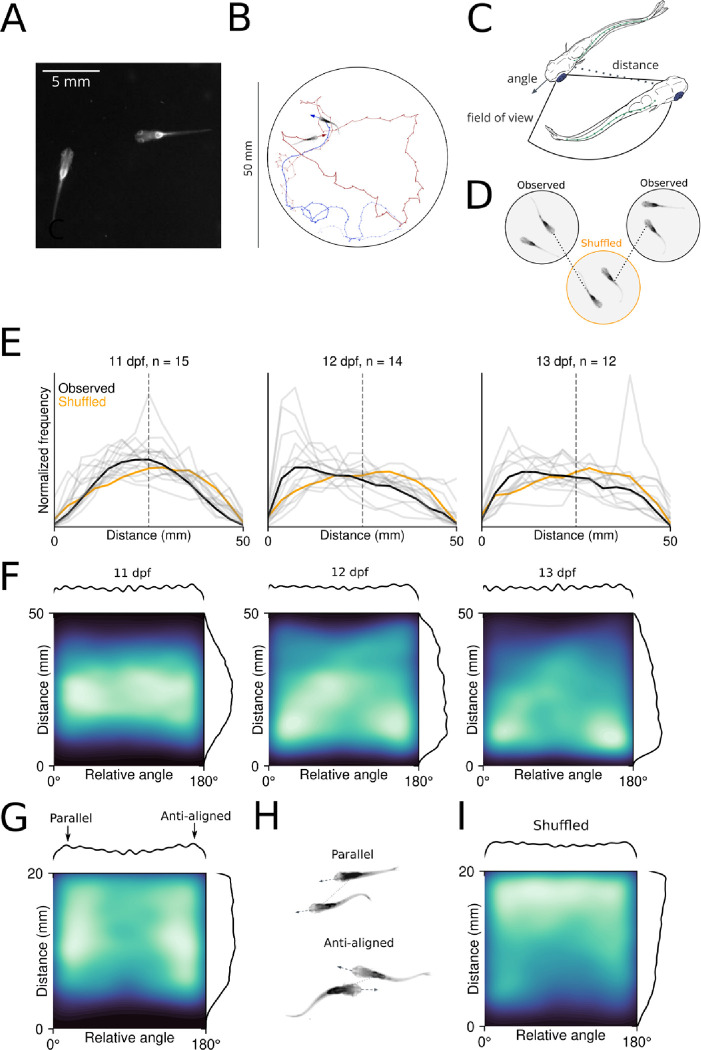
Figure 1.
A.) Example image of a pair of juvenile zebrafish as recorded in our assay. B.) Example trajectories and headings of two fish in a 50 mm circular arena. C.) Behavioral variables measured following tracking: the heading angle of each fish, the angular position of the other fish relative to the target fish’s heading, and the distance between the two fish. D.) Schematic of shuffling operation, where real data are swapped between experiments to control for spurious relationships. E.) Histograms of preferred distances across development each pair (gray lines), with the mean indicated in black. F.) 2D histograms of distance and relative angle across development, showing preferred orientations at close distances. G.) 2D histograms for 12–13 dpf at <20 mm distance, arrows on marginal plot above indicate parallel and anti-aligned relative headings. H.) Schematic of parallel and anti-aligned configurations indicated by high density regions in Figure G. I.) 2D histograms of shuffled data at <20 mm distance.

