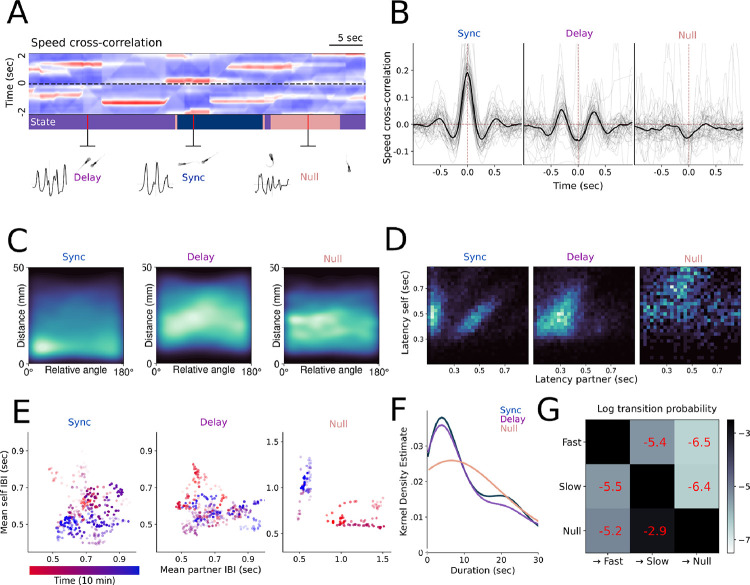
Figure 4.
A.) Example cross-correlations over a 2s sliding window, with the states inferred from the cross-correlations above annotated across time. B.) Cross-correlations derived from behavioral data after segmentation into discrete states. Grey lines are individual pairs, while the black line represents the mean. C.) 2D histograms of distance and relative angle following state segmentation, showing distance and alignment preferences for each state. D.) Relative interbout interval coordination across all states represented by phase response curves, indicating in-phase and out-of-phase components in the two interaction states. E.) Average interbout intervals for each state for a representative interacting pair over a sliding window of 1 minute, with time indicated by color, showing that preferred interbout intervals change over the course of the experiment. Opacity of data points corresponds to the correlation between all interbout intervals over the sliding window. F.) Kernel density estimate of state duration distribution. G.) Lexical transition matrix between states represented in log scale.

