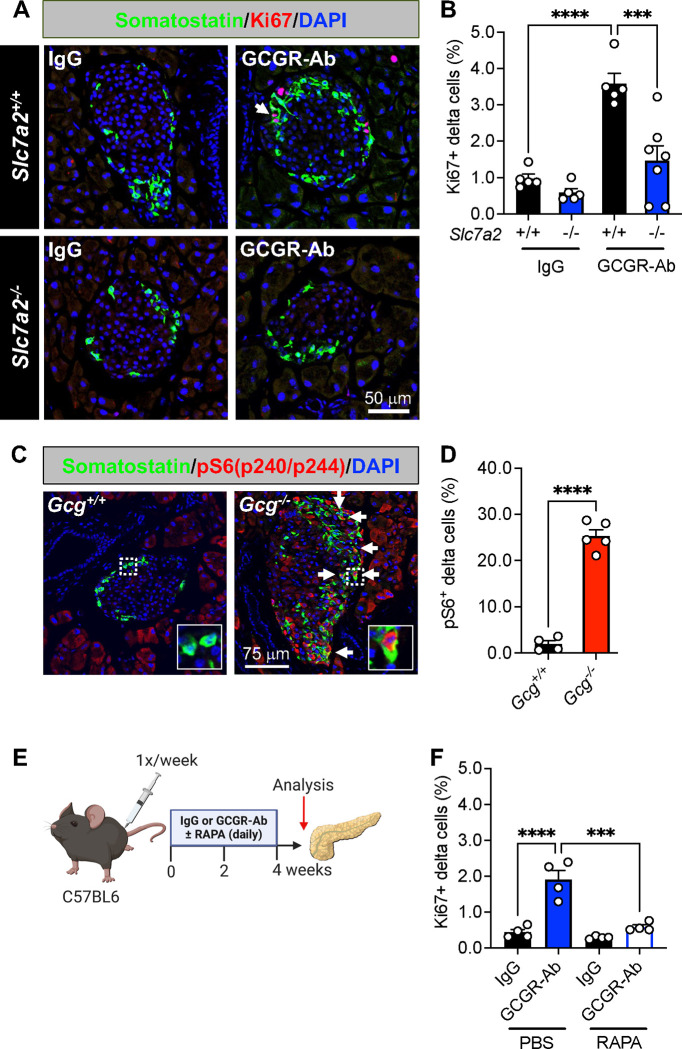
Figure 2. SLC7A2 and mTOR activation are required for delta cell proliferation in response to interrupted glucagon signaling.
(A) Representative images of pancreatic islet delta cell proliferation in Slc7a2+/+ (upper row) and Slc7a2−/− (bottom row) IgG/GCGR-Ab-treated mice. Somatostatin (green), Ki67 (red), and DAPI (blue) are shown. White arrows indicate Ki67+ somatostatin+ cells. (B) Quantification of pancreatic islet delta cell proliferation in Slc7a2+/+ (black bars) and Slc7a2−/− (blue bars) IgG or GCGR-Ab-treated mice (n=4 females and 1–3 males per genotype, one-way ANOVA with Tukey’s multiple comparisons test, ****p < 0.0001 versus Slc7a2+/+ IgG, ***p < 0.001 versus Slc7a2+/+ GCGR-Ab). (C) Representative images of pancreatic islets in Gcg+/+/Gcg−/− mice immunostained for somatostatin (green), phosphorylated ribosomal protein S6 (pS6240/244; red), and DAPI (blue). White arrows indicate pS6+ somatostatin+ cells. White dashed boxes indicate regions selected for insets. (D) Quantification of the percentage of pS6+ somatostatin+ cells in Gcg+/+ (black bar) and Gcg−/− (red bar) pancreatic islets (n=1–2 females and 3–4 males per genotype, unpaired t test, ****p < 0.0001 versus Gcg+/+). (E) Schematic of approach for IgG/GCGR-Ab (once weekly) and rapamycin (RAPA; once daily) co-treatment in C57BL6 mice. Created with BioRender.com (F) Quantification of pancreatic islet delta cell proliferation in mice co-treated with IgG (black bars) or GCGR-Ab (blue and white bar) and PBS or RAPA (all males, one-way ANOVA with Tukey’s multiple comparisons test, ****p < 0.0001 versus IgG, ***p < 0.001 versus PBS/GCGR-Ab).

