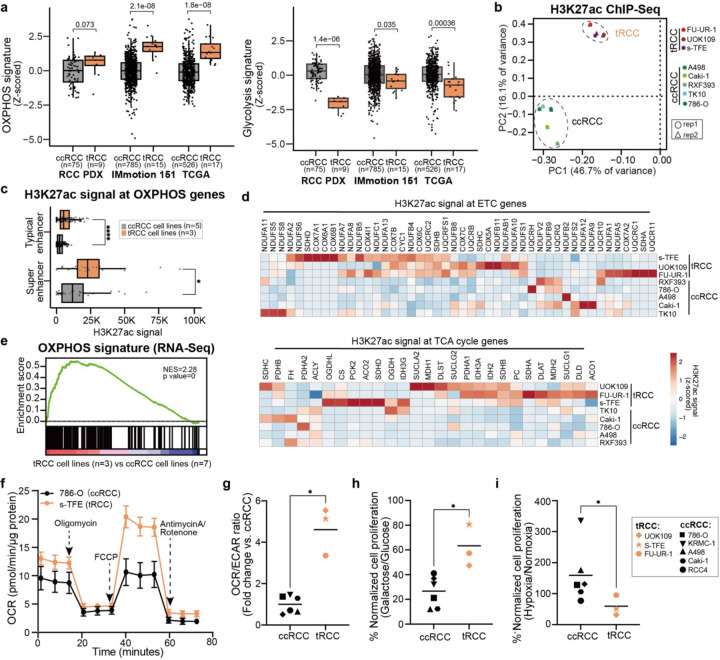
Fig. 1: tRCCs bioenergetically favor OXPHOS.
(a) OXPHOS and glycolysis gene signature scores in ccRCC or tRCC tumors from three independent studies (TCGA, Motzer et al., Elias et al. (PDX))14,43,44.
(b) Principal component analysis (PCA) of H3K27ac ChIP-Seq data across 8 RCC cell lines (3 tRCC; 5 ccRCC; 4 ccRCC lines were profiled in a previously published study, see Extended Data Fig. S1124).
(c) Boxplot of averaged H3K27ac signal at typical or super enhancers at OXPHOS genes in 3 tRCC cell lines (UOK109, FU-UR-1, s-TFE) vs. 5 ccRCC cell lines (786-O, Caki-1, RXF393, TK10, A498).
(d) Heatmap showing H3K27ac signal (quantified by ROSE2) at ETC and TCA cycle genes in tRCC vs. ccRCC cell lines.
(e) GSEA showing enrichment of OXPHOS gene signature in tRCC cell lines (n=3, UOK109, FU-UR-1, s-TFE) versus ccRCC cell lines from CCLE (n=7, A498, A704, 786-O, 769-P, Caki-1, Caki-2, OS-RC-2).
(f) Oxygen consumption rate (OCR) as measured by a Seahorse Bioflux analyzer after the addition of oligomycin, FCCP, or antimycin A/rotenone in a ccRCC cell line (786-O) and a tRCC cell line (s-TFE). Data are shown as mean ± s.d, n=5 biological replicates for 786-O cell line, n=6 biological replicates for s-TFE cell line.
(g) Ratio of (OCR) to extracellular acidification rate (ECAR) as detected by a Seahorse Bioflux analyzer in ccRCC (n=6, 786-O, Caki-1, Caki-2, KRMC-1, A498, RCC4) and tRCC (n=3, UOK109, FU-UR-1, s-TFE) cell lines. OCR/ECAR ratio represents the basal respiration:glycolytic balance in each cell line. Data are shown as mean ± s.d, n=5–7 biological replicates per cell line.
(h) Viability of ccRCC (n=6, 786-O, Caki-1, Caki-2, KRMC-1, A498, RCC4) and tRCC (n=3, UOK109, FU-UR-1, s-TFE) cell lines cultured in glucose or galactose-containing media for 6 days. Data are shown as mean ± s.d. n=3 biological replicates per cell line.
(i) Viability of ccRCC (n=6, 786-O, Caki-1, Caki-2, KRMC-1, A498, RCC4) and tRCC (n=3, UOK109, FU-UR-1, s-TFE) cell lines cultured under hypoxic (2.5% O2) or normoxic (20% O2) conditions for 10 days. Data are shown as mean ± s.d. n=3–4 biological replicates per cell line.
For panels (a), (c) and (g-i), statistical significance was determined by Mann-Whitney U test. *p < 0.05, **p < 0.01, ***p < 0.001, **** p < 0.0001, n.s. not significant.

