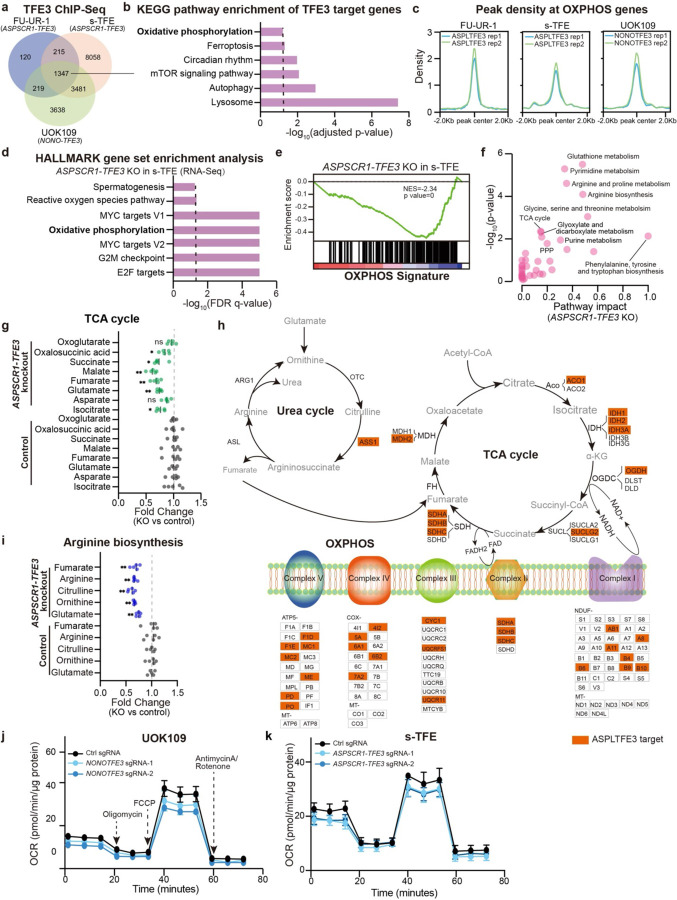
Fig. 2: OXPHOS metabolism in tRCC is driven by the TFE3 fusion.
(a) Venn diagram showing overlap of TFE3 fusion peaks detected by ChIP-Seq across three tRCC cell lines (FU-UR-1, s-TFE, UOK109).
(b) KEGG pathway analysis showing pathways significantly enriched amongst genes proximal to TFE3 fusion peaks (from shared peaks in panel (a)).
(c) Profile plot showing TFE3 fusion ChIP-Seq signal at OXPHOS genes.
(d) Bar plot showing the top gene sets depleted upon ASPSCR1-TFE3 knockout in s-TFE cells.
(e) GSEA plot showing depletion of OXPHOS gene signature in s-TFE cells upon ASPSCR1-TFE3 knockout.
(f) KEGG analysis on untargeted metabolomic profiling data displaying metabolic pathways downregulated following ASPSCR1-TFE3 knockout in s-TFE cells.
(g) Change in levels of TCA cycle-related metabolites following ASPSCR1-TFE3 knockout in s-TFE cells. For each metabolite, fold change was normalized to control sgRNA condition. Data are shown as mean ± s.d, n=5 biological replicates per cell line.
(h) Schematic of urea cycle, TCA cycle, and the mitochondrial electron transport chain (ETC), annotated with genes that are ASPL-TFE3 targets as determined by ChIP-Seq in s-TFE cells (orange box). In the schematic, enzymes are in black text, metabolites are in gray text.
(i) Change in levels of arginine biosynthesis-related metabolites following ASPSCR1-TFE3 knockout in s-TFE cells. For each metabolite, fold change was normalized to control sgRNA condition. Data are shown as mean ± s.d, n=5 biological replicates per cell line.
(j) Oxygen consumption rate (OCR) level after knockout of NONO-TFE3 in UOK109 tRCC cell line. Data are shown as mean ± s.d, n=5–6 biological replicates.
(k) Oxygen consumption rate (OCR) level after knockout of ASPSCR1-TFE3 in s-TFE tRCC cell line. Data are shown as mean ± s.d, n=8–11 biological replicates.
For panels (g) and (i), statistical significance was determined by Mann-Whitney U test. *p < 0.05, **p < 0.01, ***p < 0.001, **** p < 0.0001, n.s. not significant.

