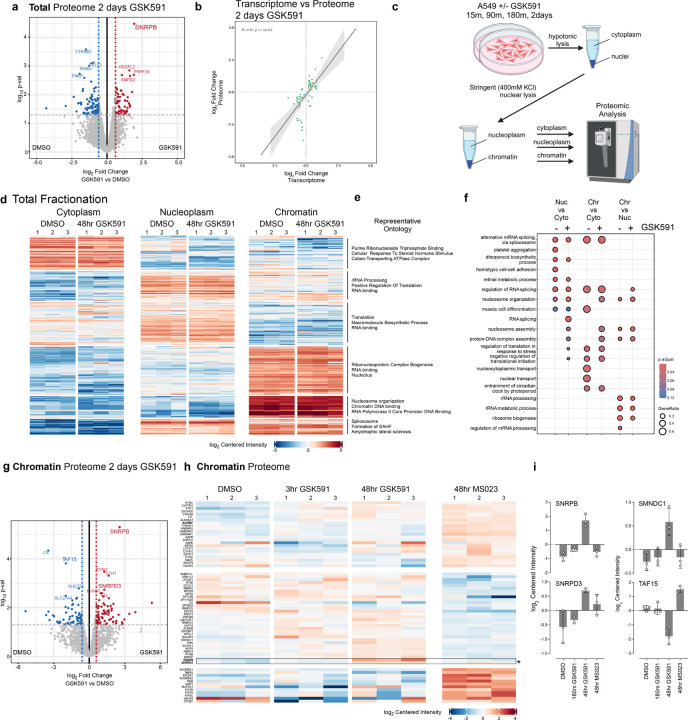
Figure 3. Fractionated proteomics reveal that SNPRB accumulation on chromatin is the major proteomic consequence of PRMT5 inhibition.
a) Volcano plot of total cell proteome following two days of GSK591 inhibition. Highlighted proteins are those above a p-value>0.05 and an absolute log2 fold change >0.58. b) Linear correlation of shared genes from total RNA-sequencing and proteomics (with a padj <0.05 cutoff) following two days of PRMT5 inhibition. c) Schematic of cellular fractionation approach. d-e) Heatmap and representative ontology for each cellular fraction and treatment. Color corresponds to a log2 of centered intensity. f) Dot plot highlighting ontology of biological function of proteins in each cellular compartment. Size of dot corresponds to gene ratio and color to the adjusted p-value. g) Volcano plot of mass-spec log2 Fold change vs log10 pval of the chromatin fraction following GSK591 treatment. h) Heatmap comparing changes in the chromatin proteome. Block color is representative of log2 centered intensity. i) Selected histograms of chromatin associated proteins and their centered intensity across different drug treatments.

