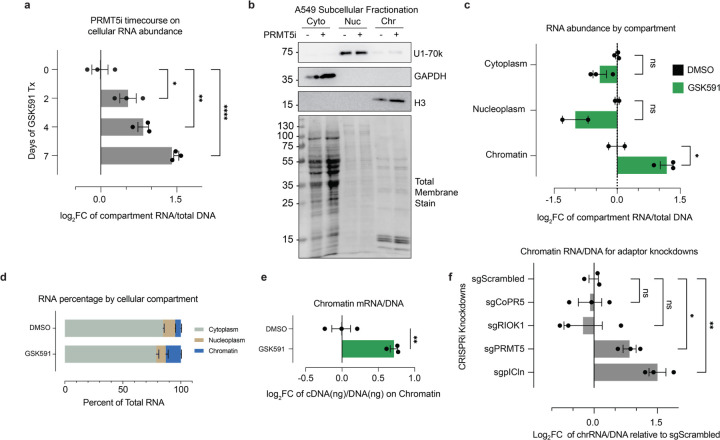
Figure 5. PRMT5 inhibition results in mRNA chromatin detention.
a) Histograms depicting the amount of total RNA per cell normalized to the amount of DNA. *<0.01, **<0.01, ****<0.0001, n.s. = not significant. b) Immunoblots validation of RNA cellular fractionation protocol into cytoplasm, nucleoplasm, and chromatin fractions. c) Gross RNA abundance per cellular compartment, normalized to DNA in the chromatin fraction. *<0.01, n.s. = not significant. d) Relative abundance of RNA per cellular compartment with GSK591 or DMSO control. e) Gross amount of mRNA on chromatin, normalized to DNA. mRNA measured via RNA conversion to cDNA using oligo dT primers. f) Relative abundance of RNA on chromatin for PRMT5 and adaptor protein knockdown, normalized to amount of cellular DNA per sample. *<0.01, **<0.01, n.s. = not significant.

