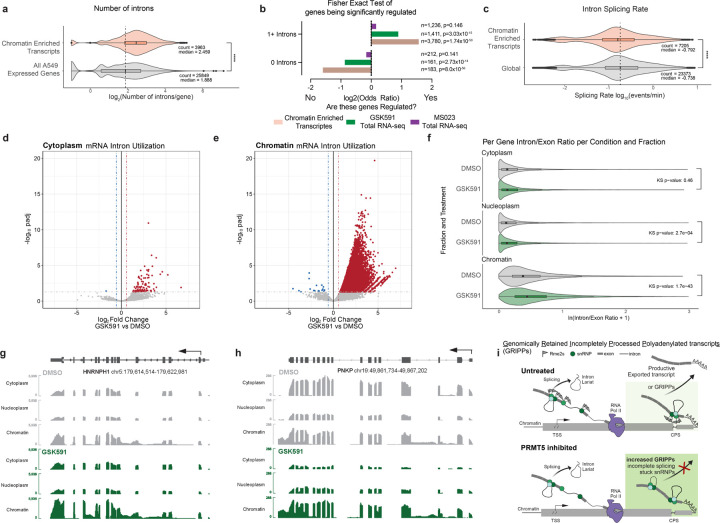
Figure 7. Chromatin enriched transcripts are defined by slower splicing rate and retained introns.
a) Number of introns per gene for chromatin enriched transcripts and all expressed genes in A549 cells. Average compared by Wilcoxon Ranked Sum test. **** signifies p < 0.0001. b) Fisher Exact Test and ODDS ratio of chromatin enriched transcripts, PRMT5i altered transcripts, and Type I PRMTi altered transcripts depending on their number of introns. c) SKaTER-seq calculated splicing rate of chromatin enriched transcripts compared to global transcript splicing rates. Distribution compared with Kolmogorov-Smirnov test. **** signifies p < 0.0001. d-e) Volcano plots of intron utilization for introns in cytoplasm, and chromatin, compared to DMSO matched controls. Red introns have a log2FC>0.58 and a padj>0.05. Blue introns have a log2FC<−0.58 and a padj>0.05. f) Violin plots representing the average Intron/Exon ratio of genes significantly expressed in each cellular compartment. The distribution of ratios per compartment was tested using the Kolmogorov-Smirnov test. g-h) Selected transcript IGV tracks demonstrating scaled transcript and intron levels in cytoplasm, nucleoplasm, and chromatin for DMSO and GSK591 treated cells. i) Model figure illustrating Genomically Retained Incompletely Processed Polyadenylated Transcripts (GRIPPs) and their dependence on arginine methylation for productive escape from chromatin.

