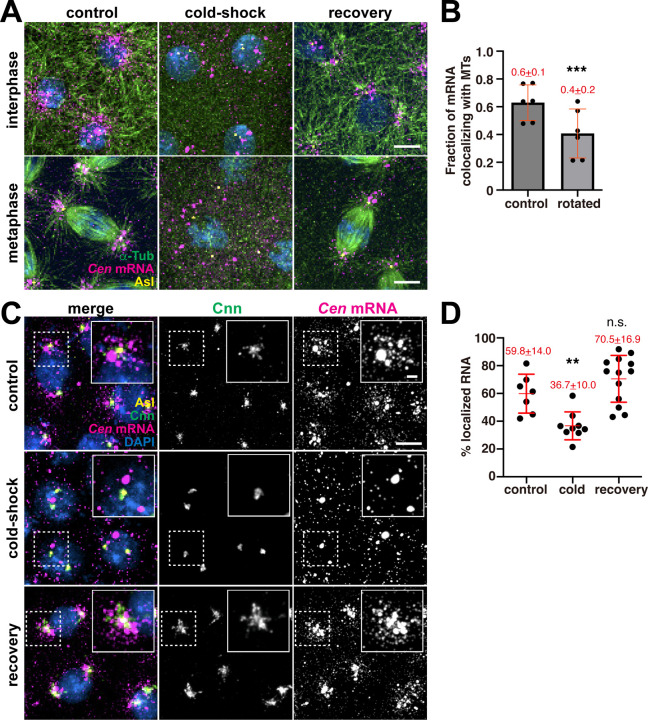
Figure 8. Microtubules enrich Cen mRNA at centrosomes.
(A) Microtubule regrowth assay. Representative images of NC 11 embryos labeled with Cen smFISH probes (magenta) and antibodies for α-Tub (green) and Asl (yellow). Nuclei are labeled with DAPI (blue) in control, cold-shock, and recovery conditions. (B) Graph shows the Mander’s coefficient of colocalization for Cen mRNA overlapping with microtubules. Each dot is a measurement from N=6 interphase NC 10–11 control embryos. The RNA channel was rotated 90° to test for specificity of colocalization. (C) Maximum intensity projections of NC 12 interphase embryos from the indicated conditions labeled with Cen smFISH probes (magenta), Cnn (green) and Asl (yellow) antibodies, and DAPI (blue). Insets show Cnn structure and Cen mRNA distribution are affected by microtubule destabilization. (D) Quantification of the percentage of Cen mRNA localizing to centrosomes (<1 μm distance from Asl surface) from N=7 control, 9 cold-shocked, and 13 recovered NC 12 interphase embryos. Mean ± SD is displayed (red). Significance was determined by (B) two-tailed t-test and (D) one-way ANOVA followed by Dunnett’s multiple comparisons test relative to the control with n.s., not significant; **, P<0.01; and ***, P<0.001. Scale bars: 5 μm; 2 μm (insets).

