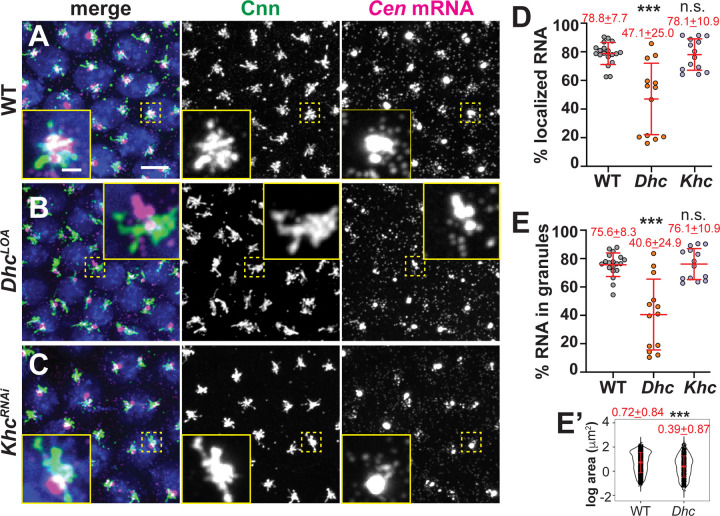
Figure 9. Dynein targets Cen mRNA to centrosomes.
Maximum-intensity projections of NC 13 interphase embryos labeled with Cen smFISH (magenta), anti-Cnn antibodies (green; centrosomes), and DAPI (blue nuclei) in (A) WT, (B) DhcLOA hypomorphic, or (C) KhcRNAi embryos. Quantification shows the percentage of total mRNA that (D) overlaps with centrosomes and (E) resides in granules at centrosomes (0 μm distance from Cnn). Each dot represents a measurement from N= 19 WT, 13 DhcLOA and 14 KhcRNAi embryos. (E’) Log transformed RNA granule area from N=4127 granules from n=23 WT embryos and N=1412 granules from n=13 DhcLOA embryos; each dot represents a single granule. Mean ± SD displayed (red). Significance by (D and E) Kruskal-Wallis test followed by Dunn’s multiple comparison test relative to WT and (E’) unpaired t-test with n.s., not significant and ***, P<0.001. Scale bar: 5μm; 1 μm (inset).

