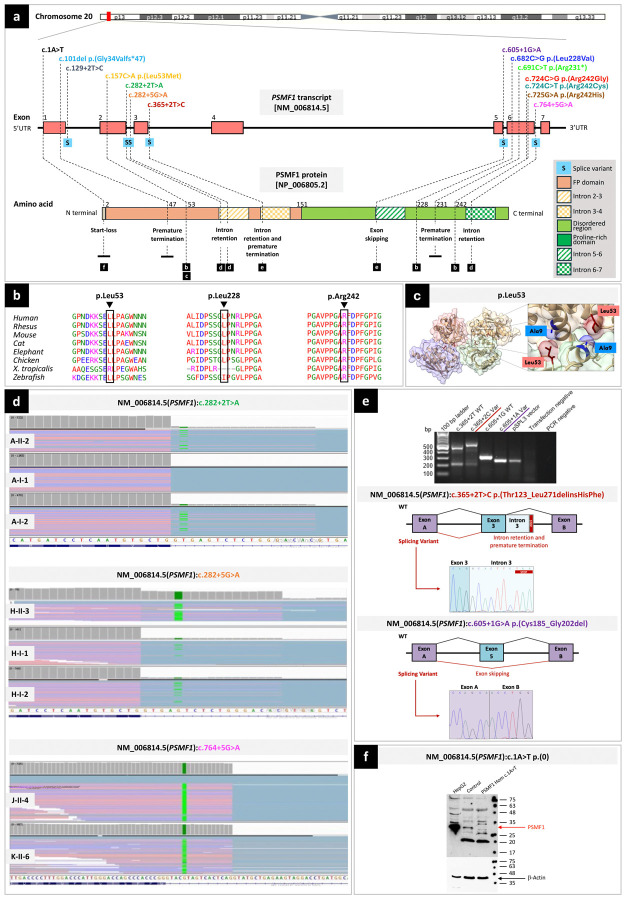
Figure 2. Location, computational analyses and functional characterization of PSMF1 variants.
(a) Schematic of PSMF1 and its protein product with location of 14 variants identified in this study and their effect. Upper part. Chromosome 20 showing position of PSMF1 on 20p13. Middle part. Schematic of PSMF1 with variants identified in the human disease gene discovery study cohort. Introns are not to scale. Exon numbers are according to the canonical transcript (NM_006814.5). Lower part. Schematic of PSMF1 protein with amino acid changes linked to disease (reference sequence NP_006805.2). (b) Interspecies alignment showing strong evolutionary conservation of the amino acids affected by the PSMF1 missense variants identified in this study across species, down to invertebrates. (c) Localization of the p.Leu53 residue within the PSMF1-PSMF1 homotetramer crystal structure, revealing a role for this residue in PSMF1 homodimerization. The residue p.Leu53 is involved in the PSMF1 variant detected in Pedigree E (Fig.1a; Supplementary File 4). Image derived from PDB 4OUH using ChimeraX. (d) RNA sequencing. Integrative Genomics Viewer screen captures showing results of RNA sequencing for Pedigree A (upper panel), Pedigree H (middle panel) and probands J-II-4 and K-II-6 (lower panel). For transcripts with PSMF1 splice variants c.282+2T>A (A-II-1, A-II-2), c.282+5G>A (H-II-3, H-I-1, H-I-2) and c.764+5G>A (J-II-4, K-II-6), IGV enables to visualize (partial) intron retention. (e) Minigene (splicing) assays. Upper panel. Agarose gel of the RT-PCR from the minigene cDNA. Medium panel. Splicing schematic of the NM_006814.5(PSMF1):c.365+2T>C variant showing intron 3 retention with stop codon sequence marked. Bottom panel. Splicing assay of the NM_006814.5(PSMF1):c.605+1G>A (bottom) variant shows exon skipping. (f) Western blot to functionally characterize the start-loss variant NM_006814.5(PSMF1):c.1A>T. Protein lysates (30μg) from HepG2 cells, and either control or patient fibroblasts (M-II-5) were analyzed by Western blotting using a polyclonal anti-PSMF1-Ab. HepG2 cells express PSMF1 at high levels, control but not patient fibroblasts express PSMF1. β-actin expression was used as loading control.

