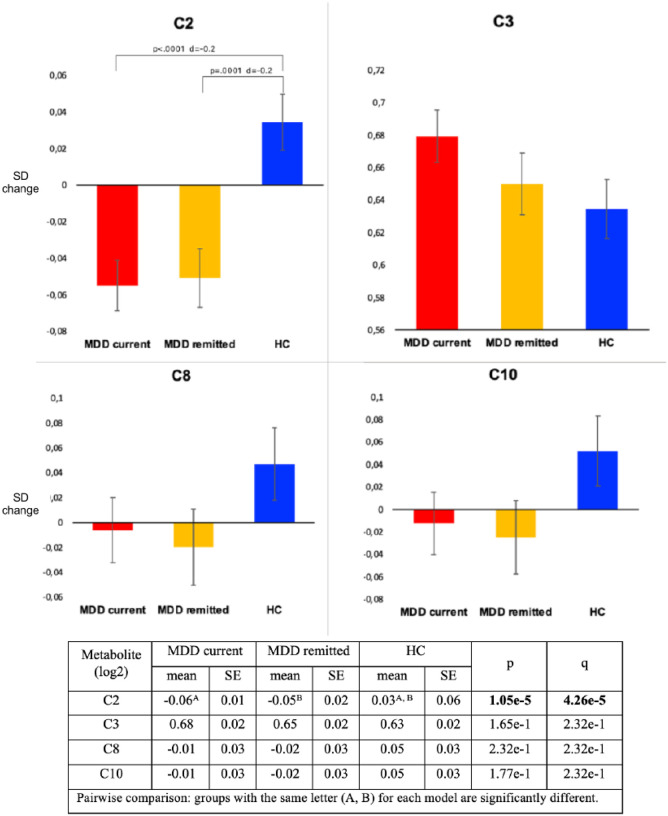
Figure 2.
Metabolite levels across the three groups: current MDD (n=1035), remitted MDD (n=739) and healthy controls (n=800).
Y-axes: SD change. Analysis were adjusted for age, sex, education and shipment. Adjusted P-levels (q) are obtained by BH-FDR (Benjamini-Hochberg False Discovery Rate) correction, used to control the rate of false positives in multiple testing. F

