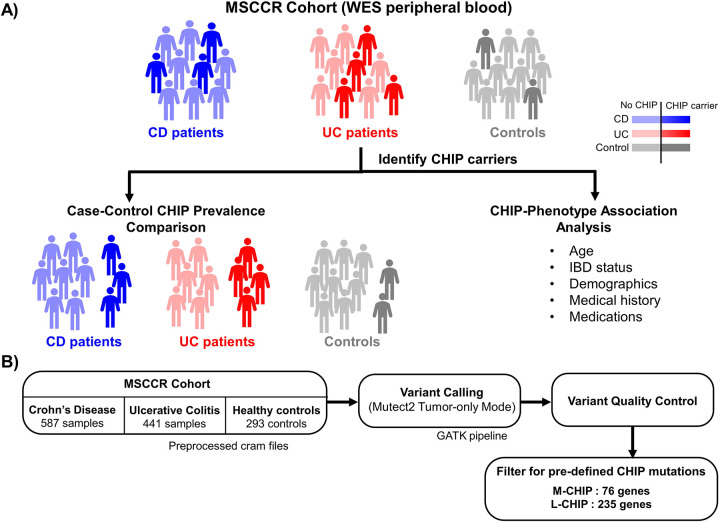
Figure 1. Study design and computational analysis flowchart.
A) Study design - We first studied CHIP prevalence in Mount Sinai’s IBD cohort using whole exome sequencing data of IBD patients (CD and UC) and controls. Next, we associated CHIP prevalence with respect to age, demographics and disease characteristics (medications and medical history) B) Pipeline to identify M-CHIP and L-CHIP mutations.
Alt text: A diagram with stick figures representing the cohort used in the study and a flow chart describing filtering pipeline for CHIP variant calling.

