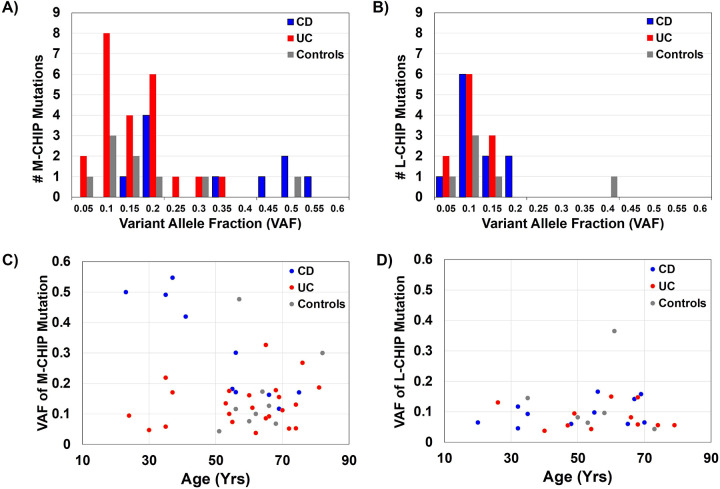
Figure 3. Variant allele fraction (VAF) of M-CHIP and L-CHIP mutations.
Histogram of the VAF of M-CHIP mutations (A) and L-CHIP mutations (B). CD patients exhibited higher VAF M-CHIP clones compared with UC (OR 6.67, 95% CI 1.18–37.78, p = 0.032). VAF of mutations and age of M-CHIP mutations (C) and L-CHIP mutations (D) observed in UC, CD, and controls. Younger CD patients had higher VAF M-CHIP mutations compared to older CD patients (OR 33.0, 95% CI 1.90–5507.82, p = 0.013)
Alt text: A four paneled figure reporting variant allele fraction of M and L CHIP mutations and the distribution of VAF across ages of participants.

