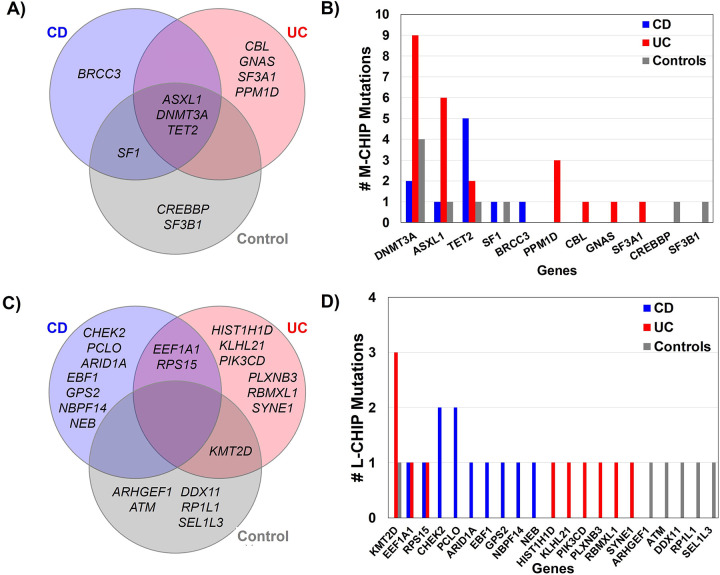
Figure 5. M-CHIP and L-CHIP genes in CD, UC and controls.
Venn diagram showing overlap of specific genes identified in CD, UC, and controls for M-CHIP (A) and L-CHIP (C). Number of mutations identified in M-CHIP genes (B) and L-CHIP genes (D) categorized by CD, UC, and controls.
Alt text: A four paneled figure including Venn diagrams showing overlap of genes identified in each IBD subtype, and frequency of genes across each subtype.

