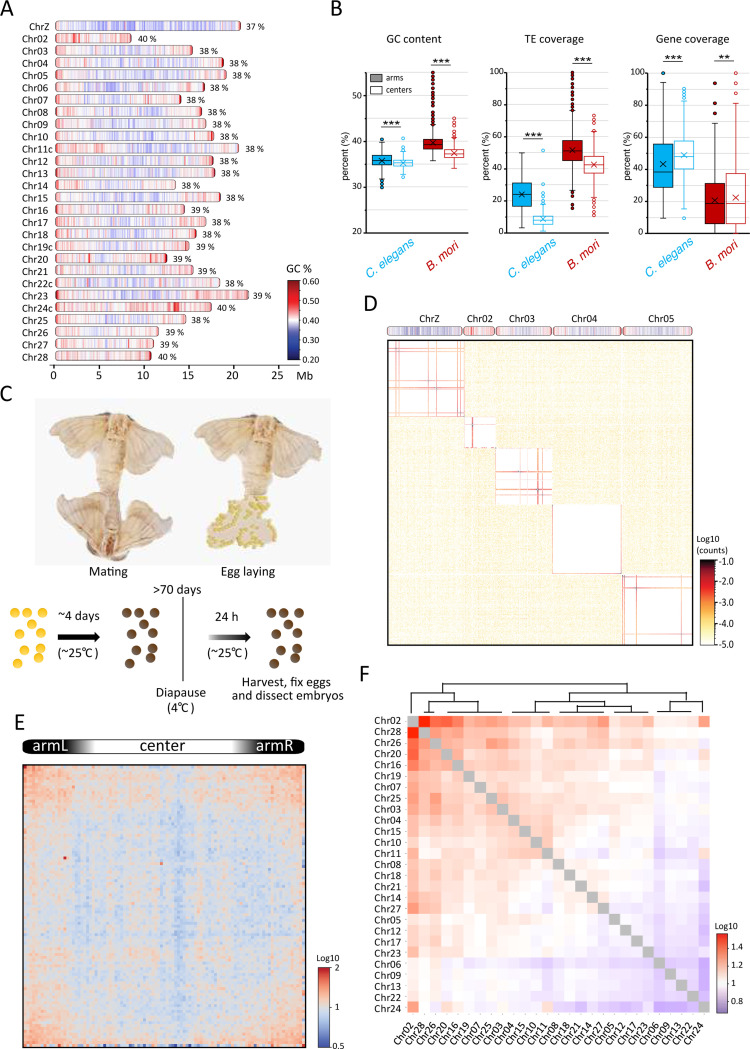
Figure 1: Hi-C of Bombyx mori embryos reveals highly distinct chromosome territories.
(A) Schematics of B. mori chromosomes drawn to approximate scale indicated in Mb below. For each chromosome, total GC content in percentage is noted, and local GC content per 100 kb windows is indicated as a color scale from blue (<20%) to red (>60%). A suffix “c” added to a chromosome’s name indicates assembly corrections were made (Figure S9). (B) Box plots showing the distribution of GC content, TE coverage, and gene density per 100 kb window in center and arm regions of autosomes in C. elegans and B. mori. Statistical significance was tested using a Mann-Whitney U-test, **: P-value < 0.05, ***: P-value < 0.005. Box region corresponds to data between the first and third quartile. Lines indicate medians of respective distributions, while crosses correspond to their means. Whiskers extend to the lowest and highest data points, excluding outliers, which are shown as dots. (C) Sample generation for Hi-C and ChIP-seq. (D) Contact map at 80 kb bin resolution of five selected B. mori chromosomes (on top). (E) Average inter-chromosomal (trans) observed contacts versus expected matrix for all scaled B. mori chromosomes, computed at 40 kb bin resolution. (F) Heatmap illustrating observed-over-expected inter-chromosomal contact frequencies as a divergent color scale from blue to red. Chromosomes have been clustered and ordered to reflect similar contact patterns.

